Category Hourly
This report provides an hourly breakdown of sales by category, making it possible to identify peak and low traffic hours and view the quantity sold and total sales amount for each time period.
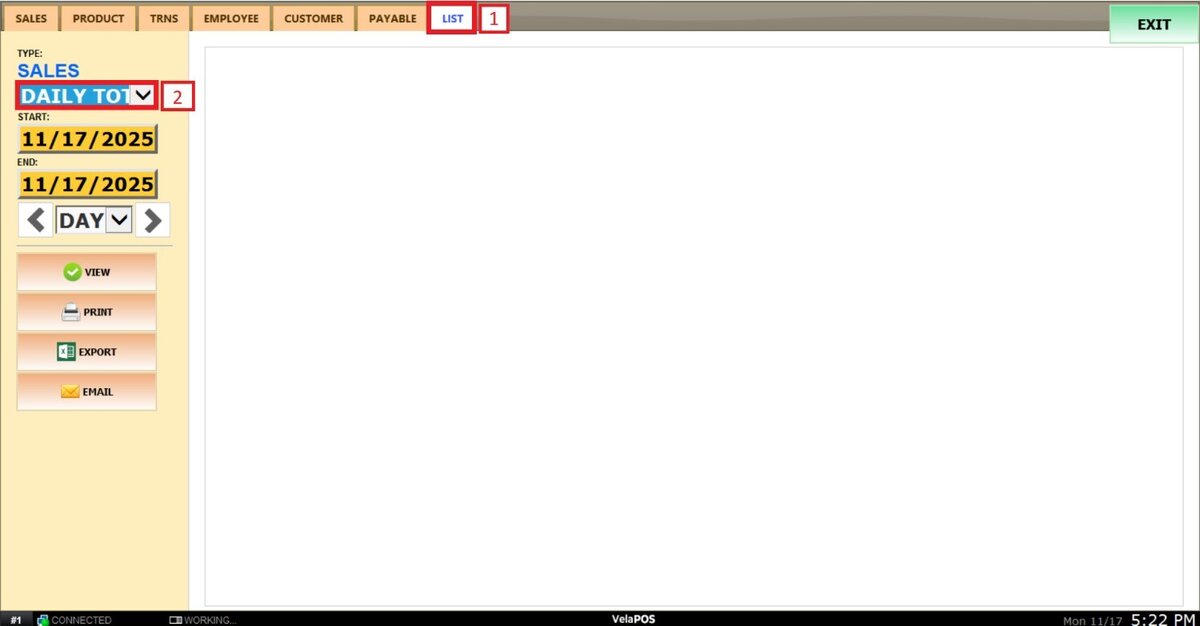
Main Screen> MENU> REPORTS> LIST
On the Main Screen, go to MENU and select REPORTS.


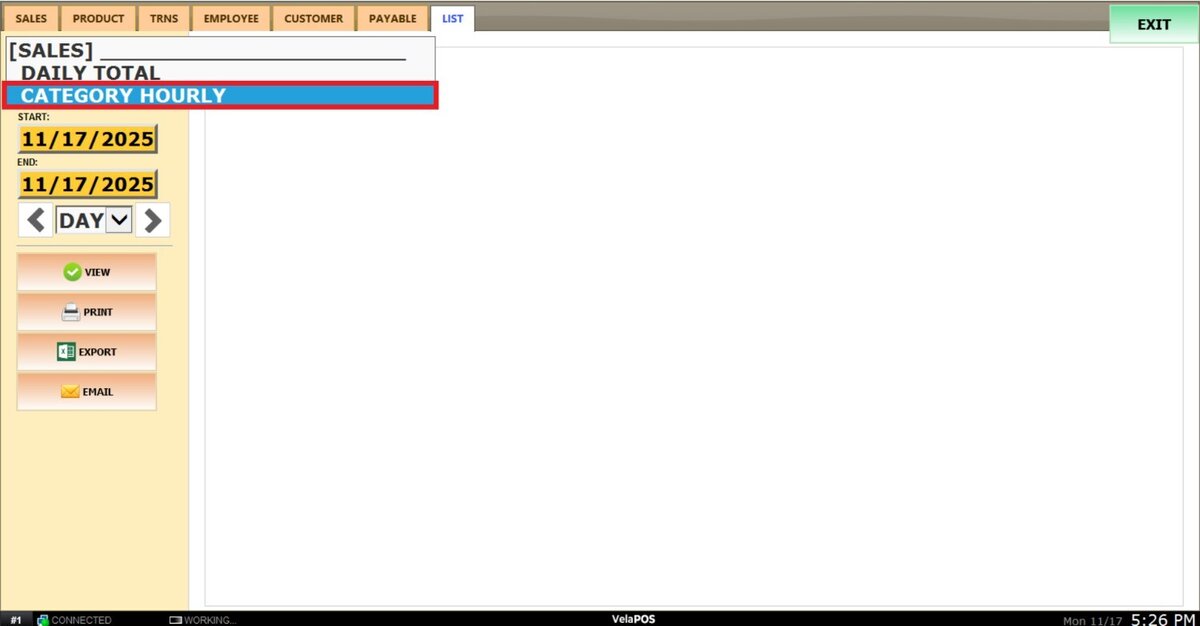
Go to the LIST tab and open the SALES drop-down menu.
Select CATEGORY HOURLY.
FILTERS
Use the filters to define how the report is grouped and displayed.
1. Filter by customized range: To view the report, begin by selecting its date range. Press on the START field to input the starting date.
A calendar screen appears where the date (day, month, and year) can be selected.
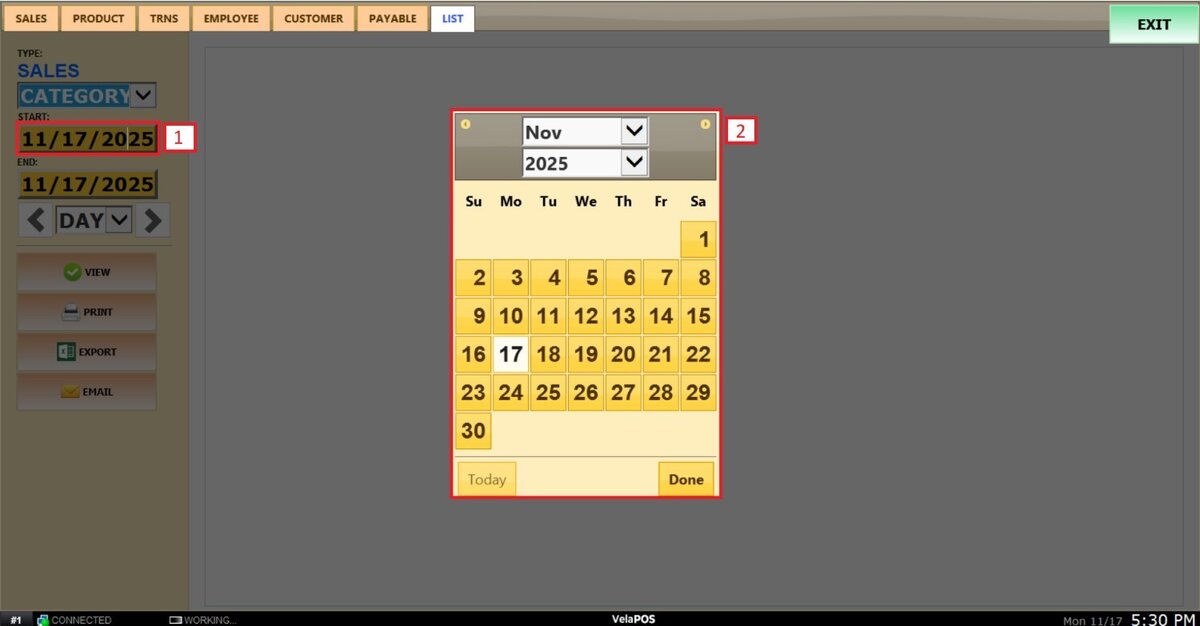
Press on DONE.
Repeat the same process for the END field to set the final date of the report.
2. Filter by a time frame: The report can be filtered by time frame (day, week, month, quarter, year).
Select the field and choose the desired time duration.
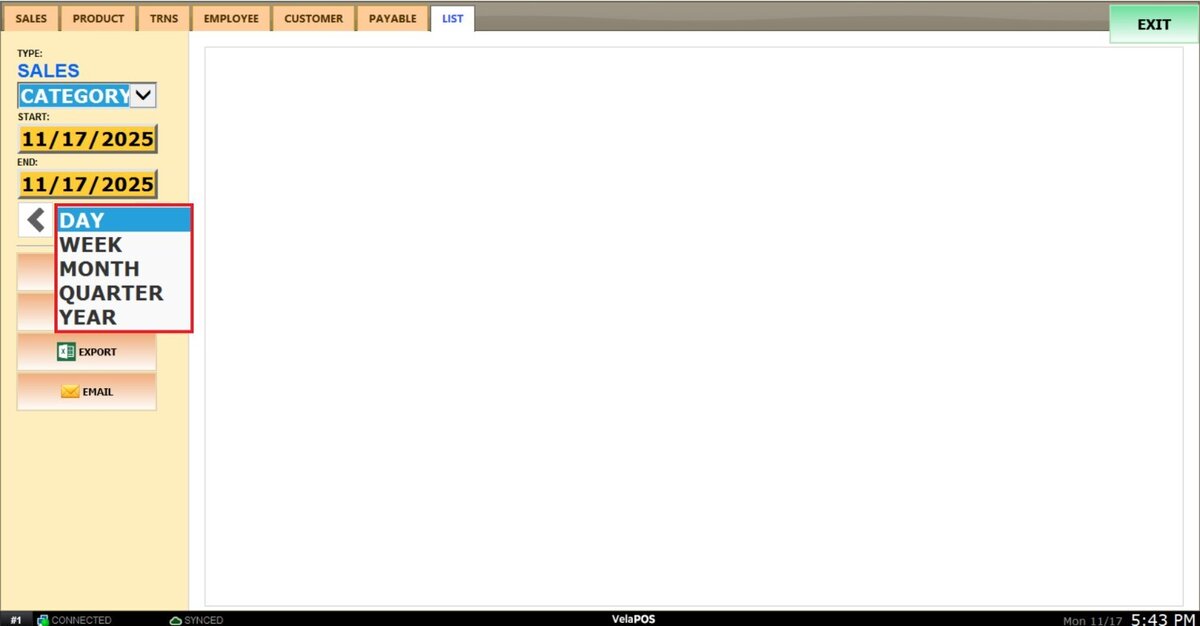
Depending on whether Day, Week, Month, Quarter, or Year is selected, the side arrows can be used to move forward or backward through those time periods.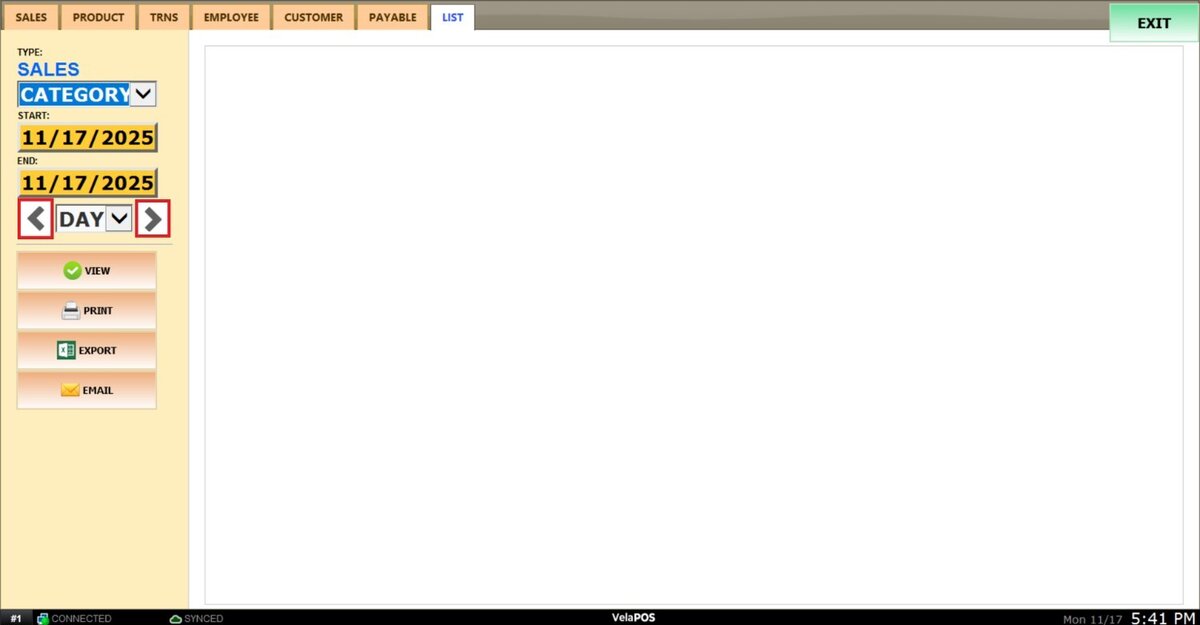
Tap VIEW to apply the filters and generate the report.

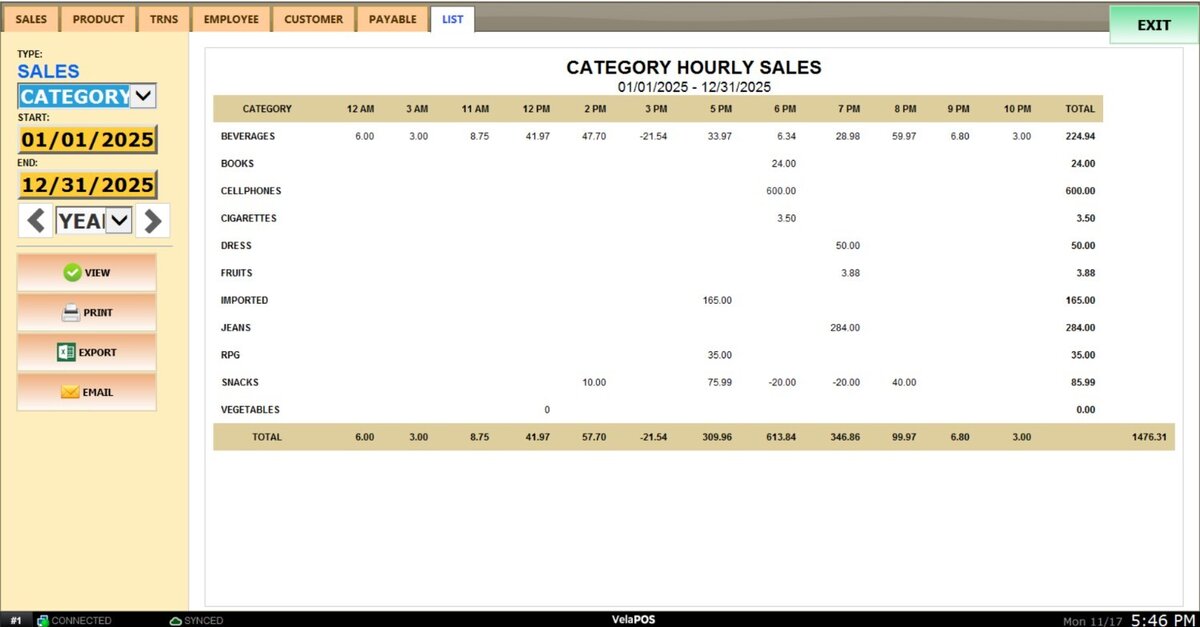
VIEW
The report will display the hourly amount for each category, the combined total sold per hour, the total sales amount per category, and the overall total for the selected date range.
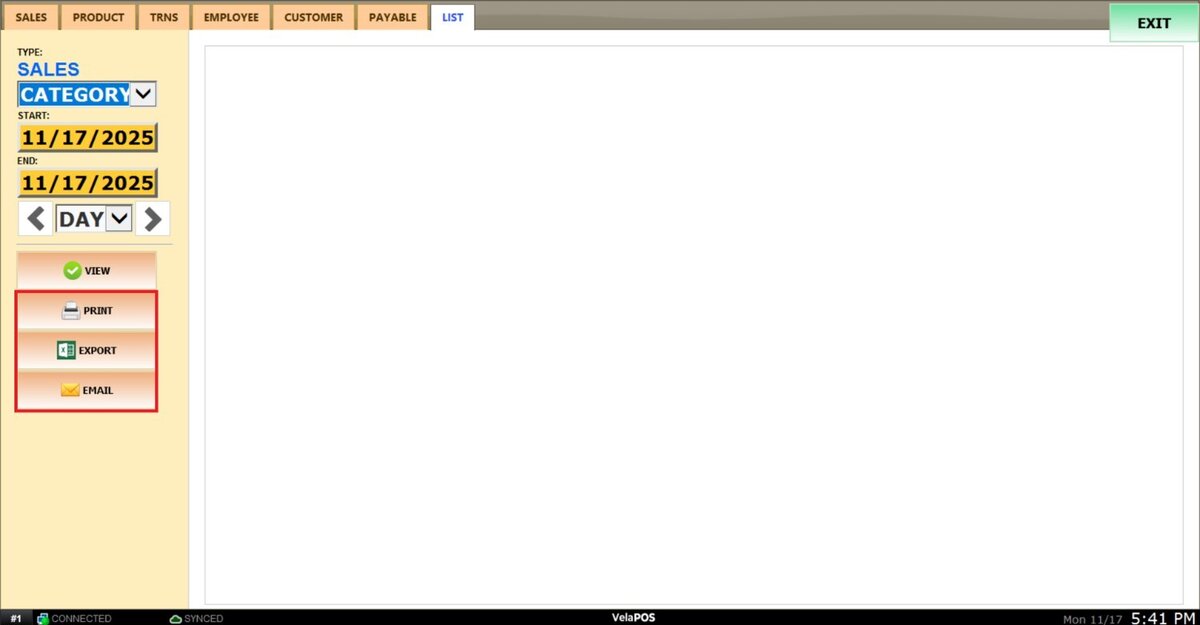
PRINT, export to EXCEL, or EMAIL the report.