Inventory Reports
This report provides a detailed breakdown of your inventory, including sold items and products with low stock.
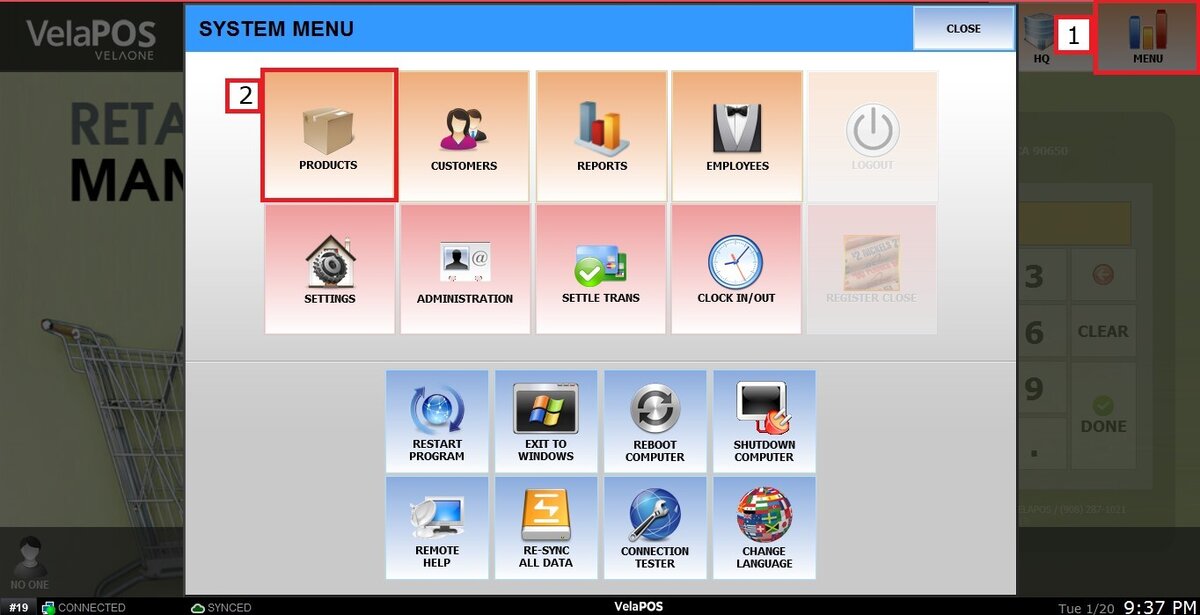
Main screen> MENU> PRODUCTS> INVENTORY> REPORT.
Go to MENU and press PRODUCTS.
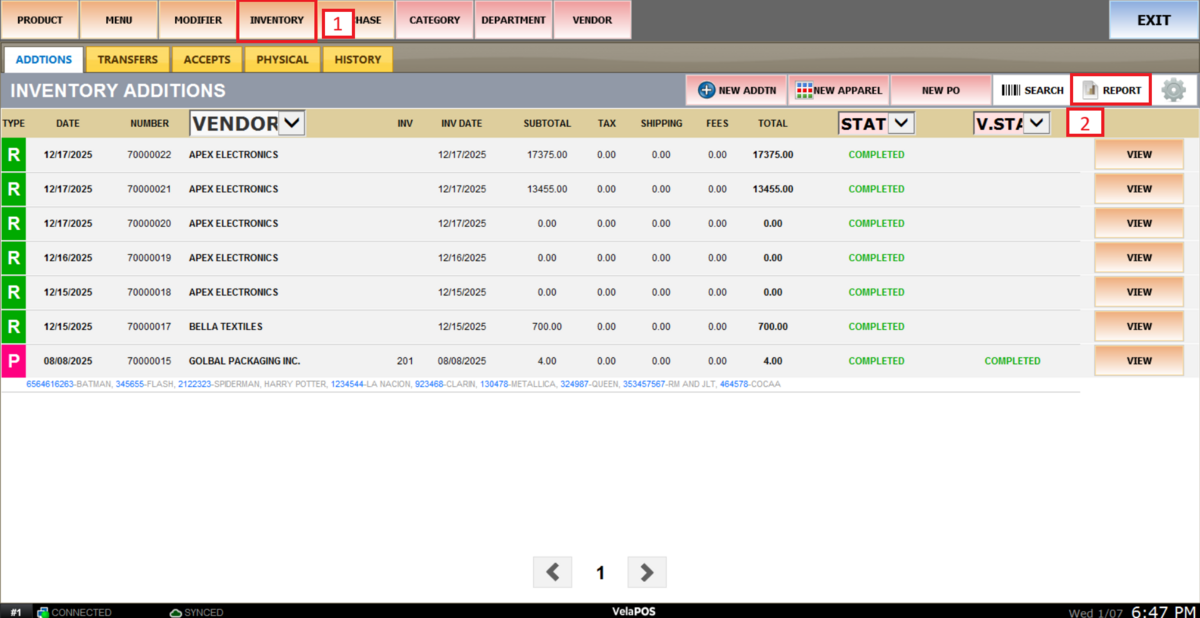
Select the INVENTORY tab and press on REPORT.
LOW STOCK REPORT
Note: Before viewing this report, make sure each product has both a Minimum and Maximum Parlevel set.
On the LOW STOCK tab, you can track products that have fallen below their defined stock levels.

Filters
You can use the available filters to narrow down the results and view specific product groups.
1. VENDOR: Filter products by supplier.
Select a vendor to filter the list and display only the low-stock items sourced from that vendor.
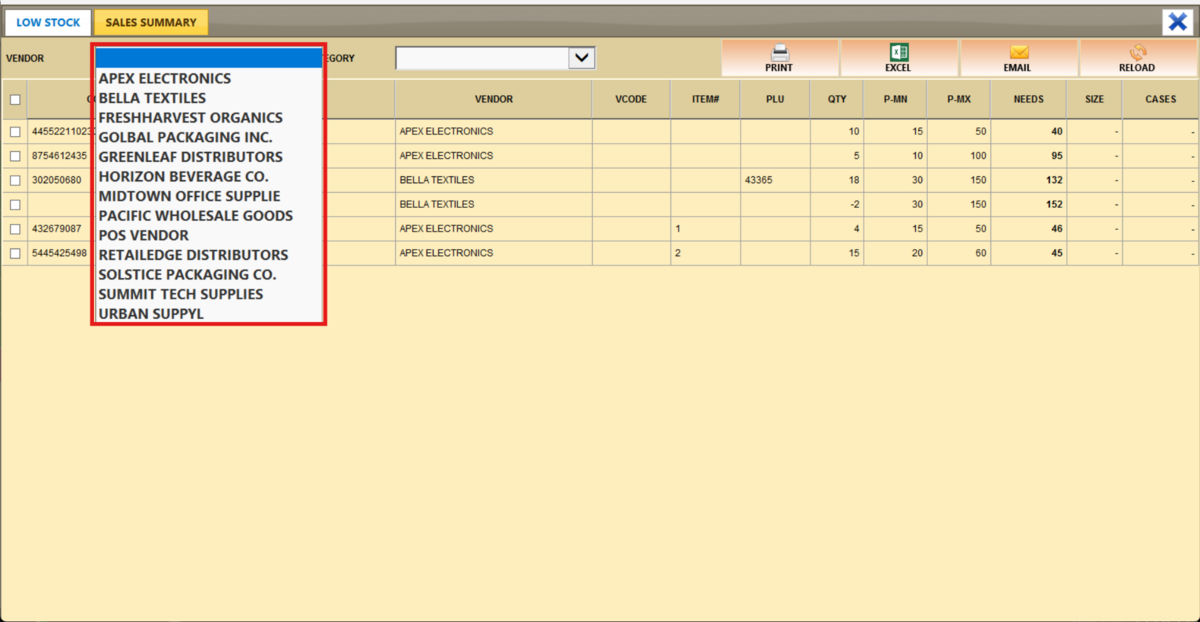

2. CATEGORY: Filter products by category to review stock levels for a specific group (e.g., beverages, snacks).
Select a category to view only their low stock items.

Report Actions
PRINT: Generate a printable version of the report.
EXCEL: Export the data to an Excel file for analysis or recordkeeping.
EMAIL: Send the report directly via email.
RELOAD: Update the report to show the most recent data.

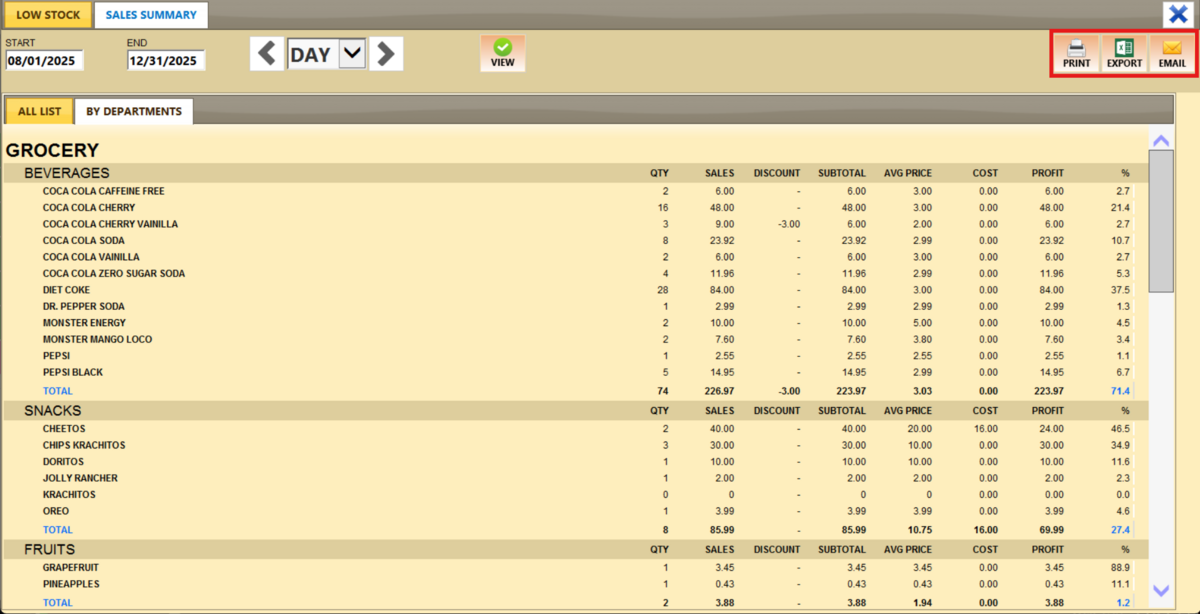
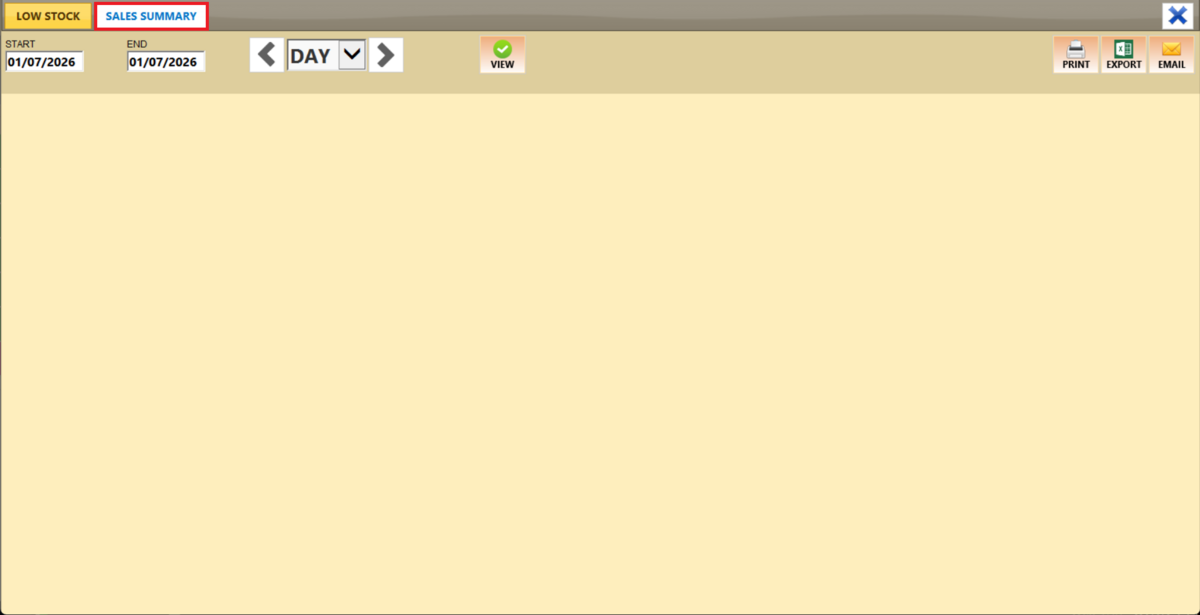
SALES SUMMARY REPORT
On the SALES SUMMARY tab, you can view a detailed breakdown of the items sold.
Filters
Use the filters to define how the report is grouped and displayed.
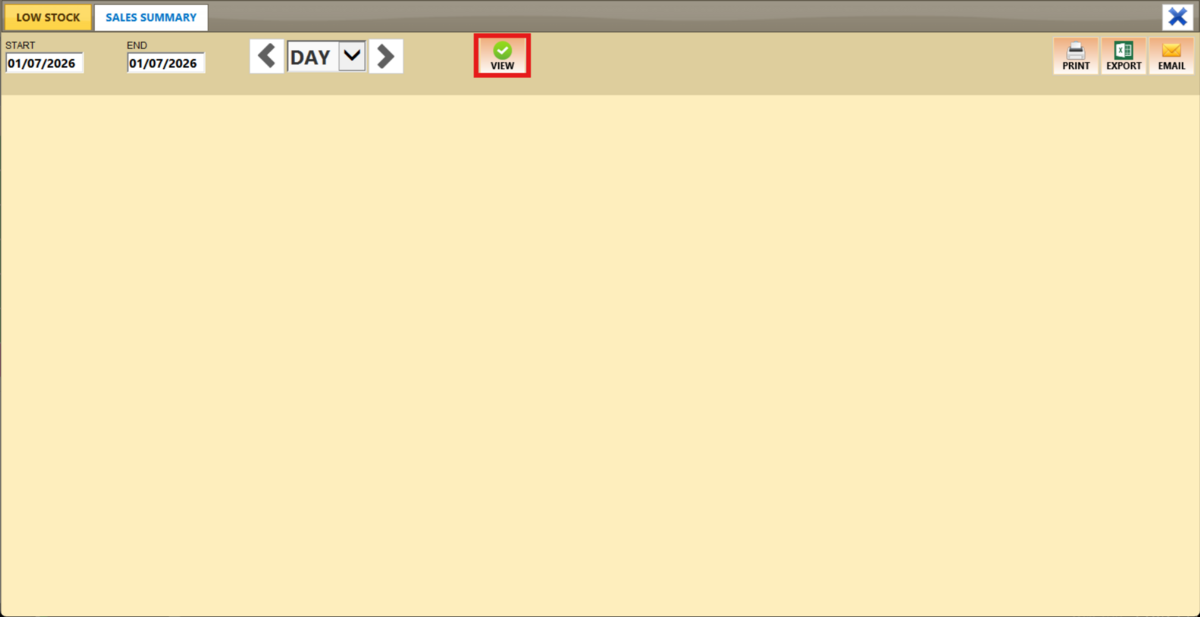
1. Filter by customized range: To view the report, begin by selecting its date range. Press on the START field to input the starting date.
A calendar screen appears where you can select the date (day, month and year). Press on DONE.

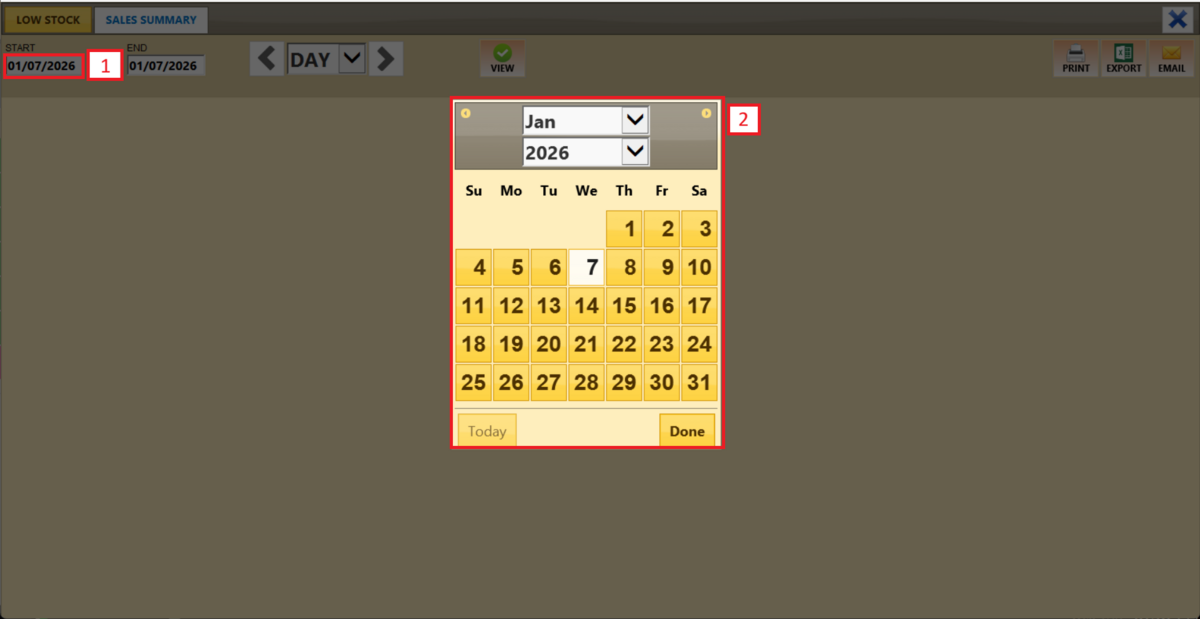
Repeat the same process for the END field to set the final date of your report.
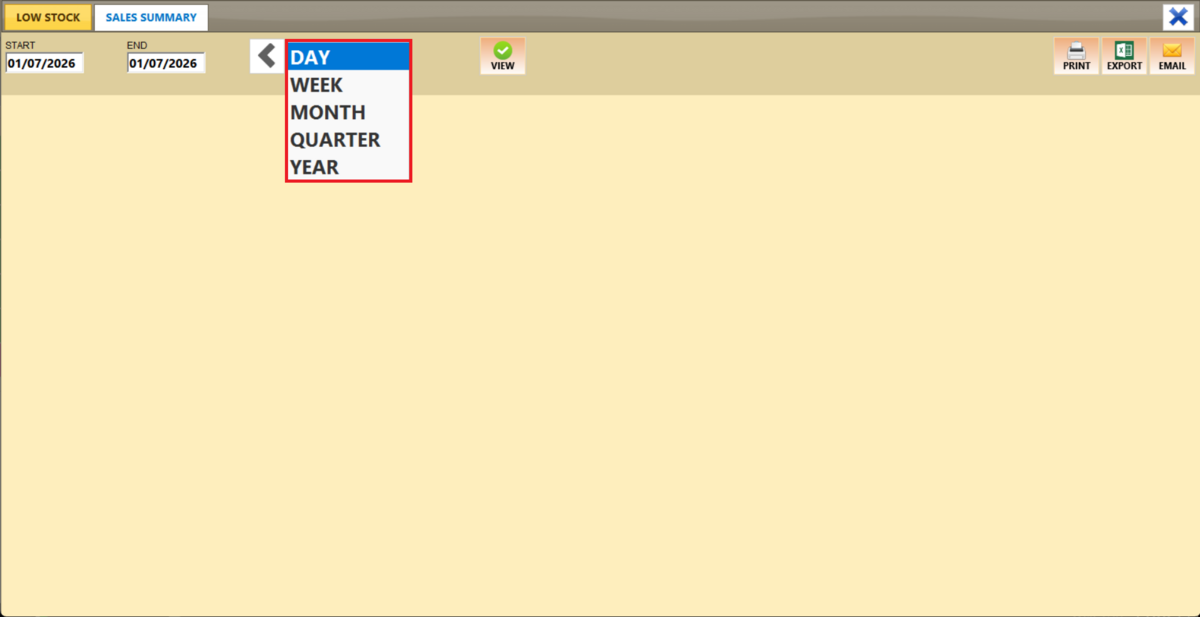
2. Filter by a time frame: You can filter the report by time frame (day, week, month, quarter, year).
Press on the field and select the time duration of your choice..

Use the side arrows to move forward or backward through the selected time periods.

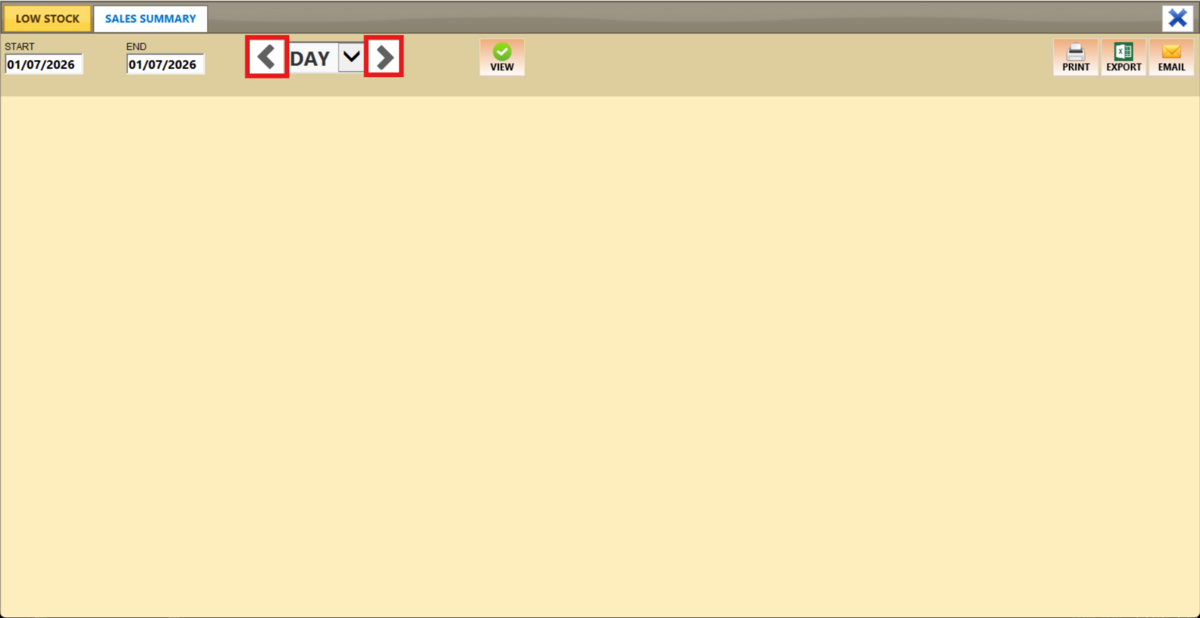
Click on VIEW to apply the filters and generate the report.
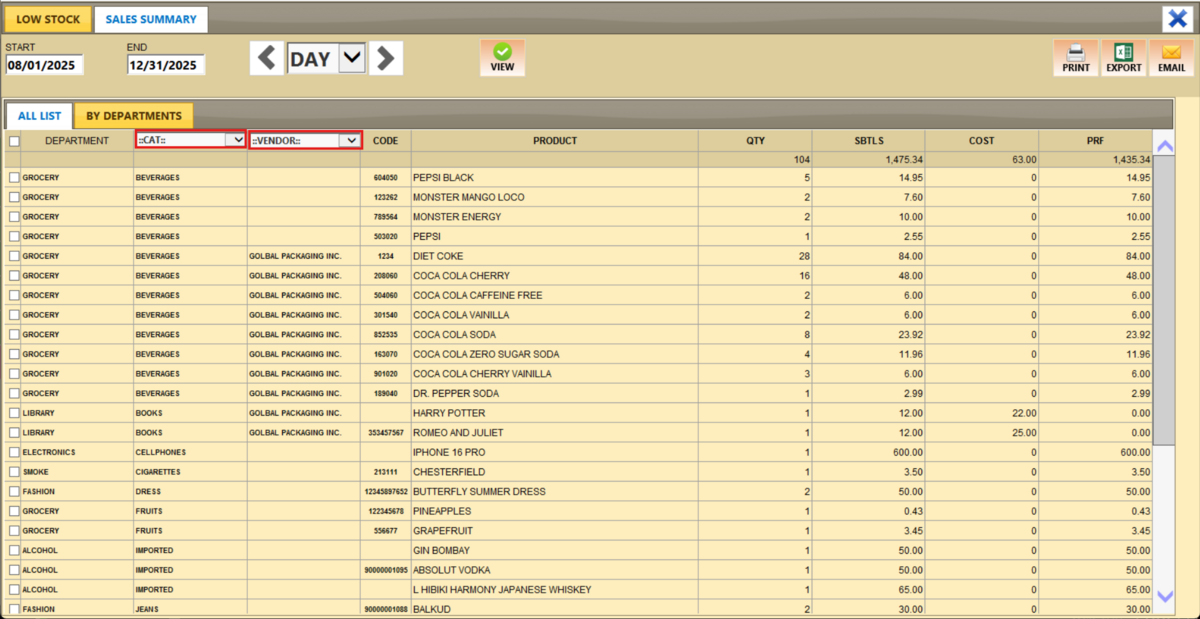
On the ALL LIST tab, you will see a list of all items sold within the selected time frame.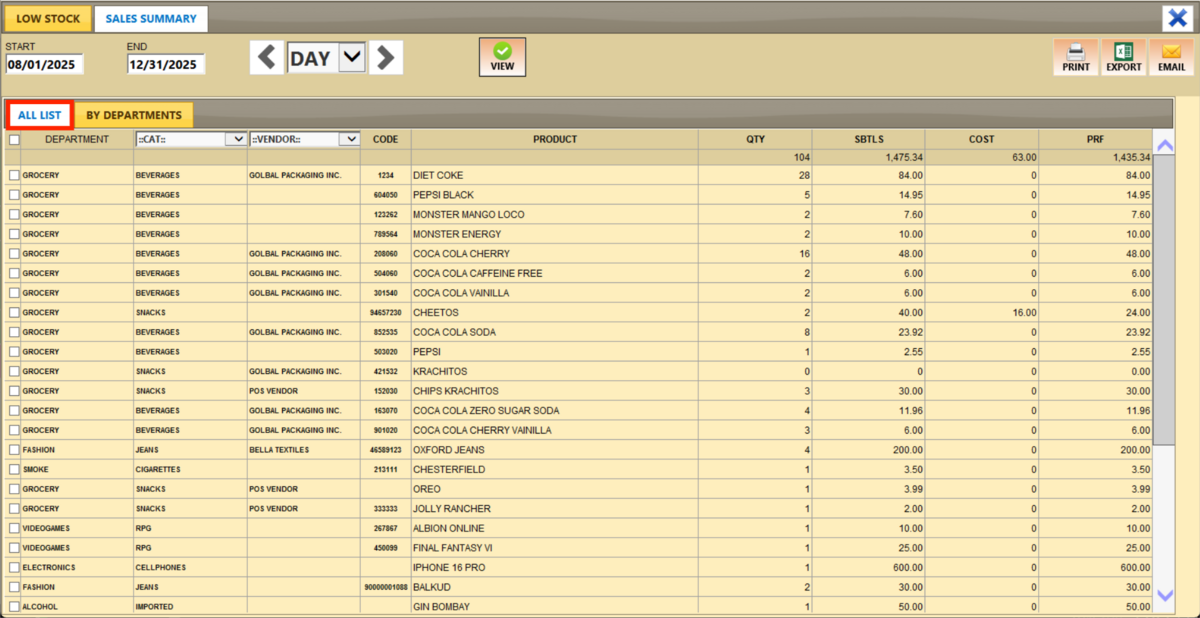
You can filter by CATEGORY or VENDOR to view specific product groups.
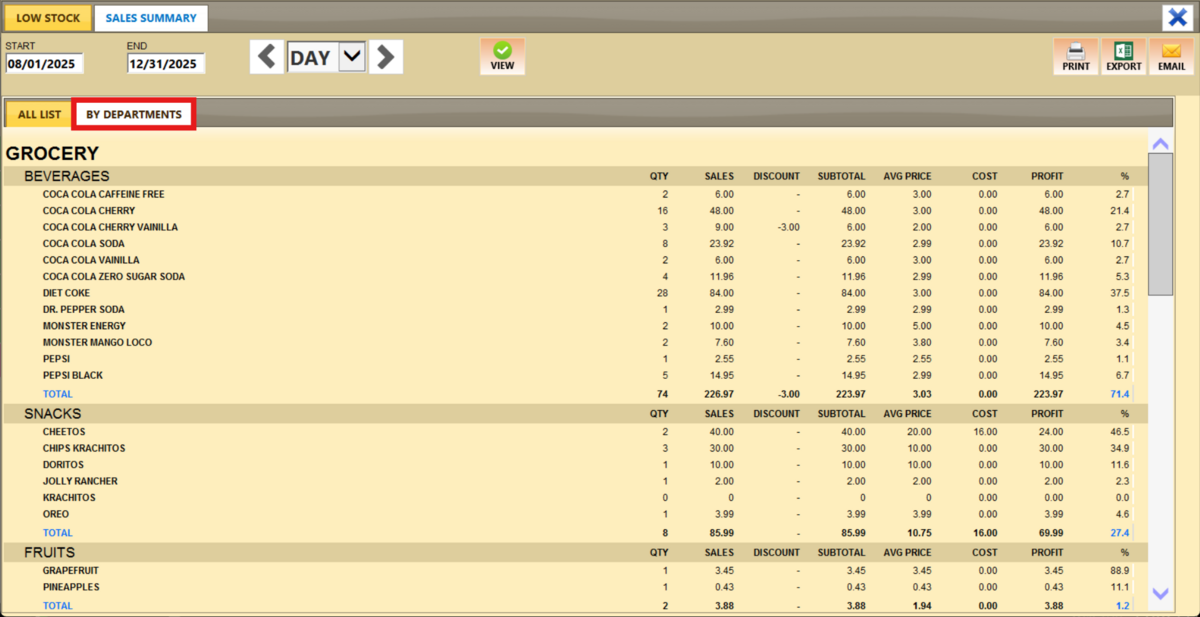
The BY DEPARTMENTS tab displays a sales summary report organized by department.
Report Actions
PRINT: Generate a printable version of the report.
EXCEL: Export the data to an Excel file for analysis or recordkeeping.
EMAIL: Send the report directly via email.