Product (Online Report)
This report provides a detailed overview of items sold over a selected period, offering key insight into product performance and overall profitability.
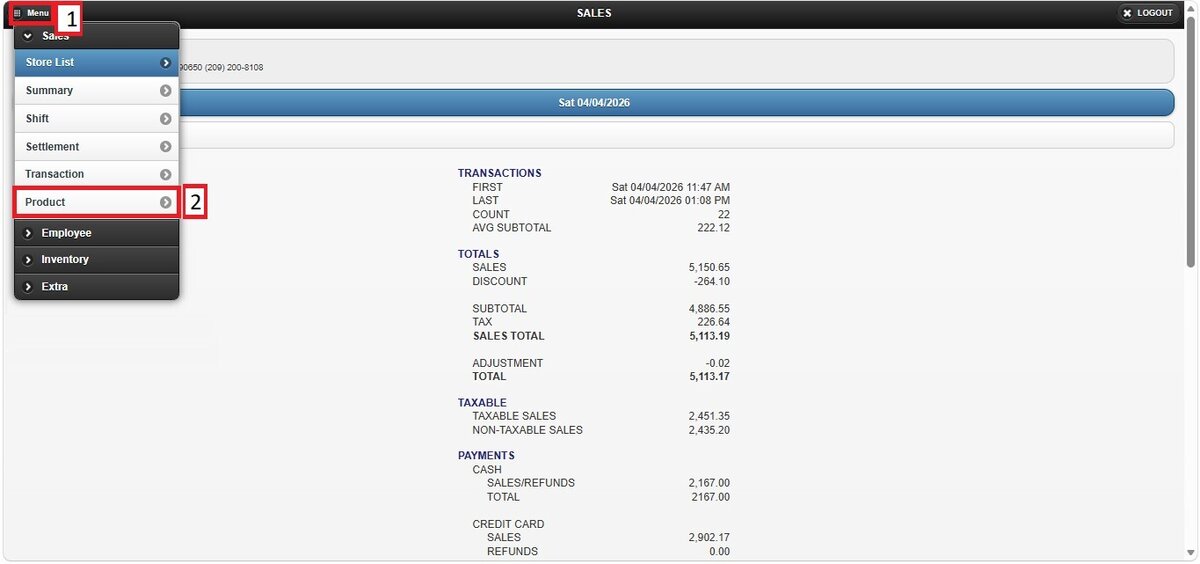
Login Screen> Select Store> MENU> PRODUCT
From the Login Screen of Online Reports, enter your credentials and press OK.

Select the store you would like to view, then navigate to the MENU button and select PRODUCT.
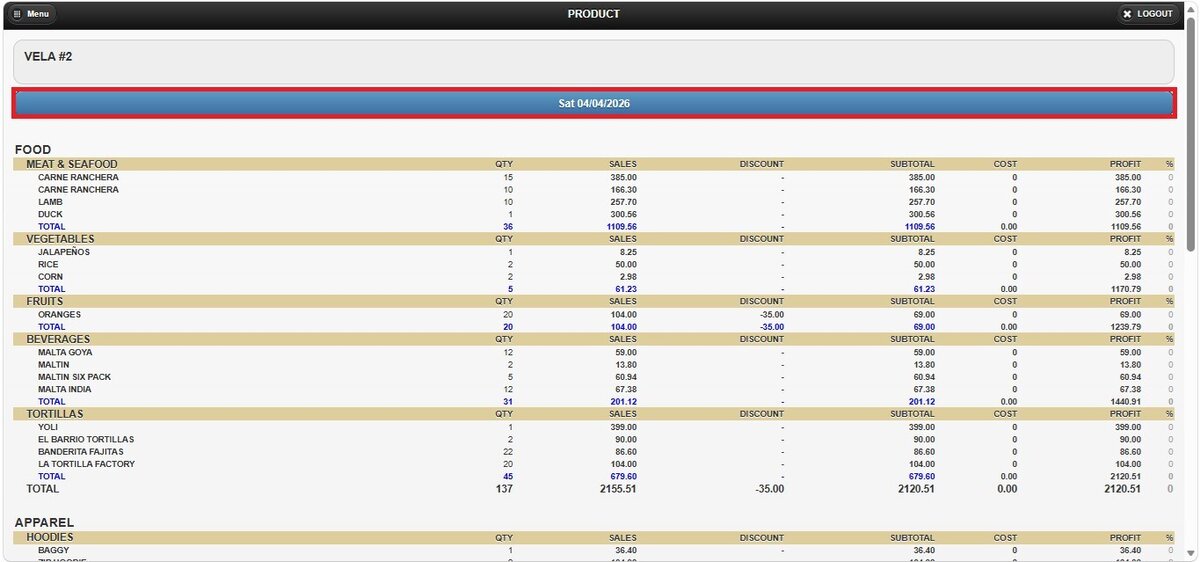
By default, the report displays data for the current day, including detailed information such as quantities sold per product within their respective categories, total revenue for the selected date, applied discounts, and if product costs are configured calculated profit.

Filters
You can refine the report using the following filtering options:
1. Custom Date Range: Located below the store name, this option allows you to view sales within a specific date range.
Click the date field to open the pop-up window.
Select the START DATE using the date picker.
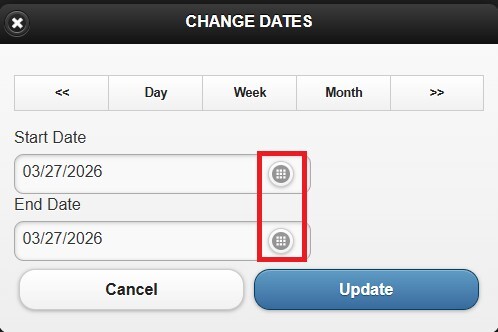
Select the END DATE field to define the final date.
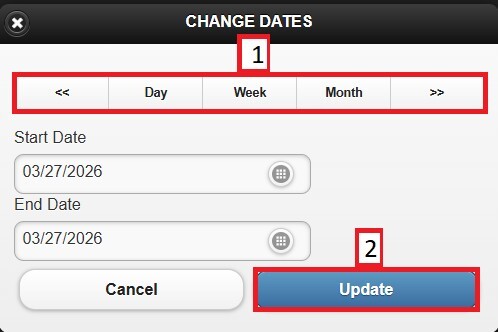
2. Time Frame Filter: Also located in the date section, this option allows quick selection of predefined periods.
On the pop-up window, select DAY, WEEK, or MONTH. Use the side arrows to navigate forward or backward through the selected period.
Click UPDATE to apply the selection.