Discounts
This report allows you to review and analyze all discounts applied within the system, helps you monitor discount activity, identify trends, and ensure proper control over pricing and promotions.
Main Screen> MENU> REPORTS> PRODUCT> SALES> DISCOUNTS
Go to MENU and press REPORTS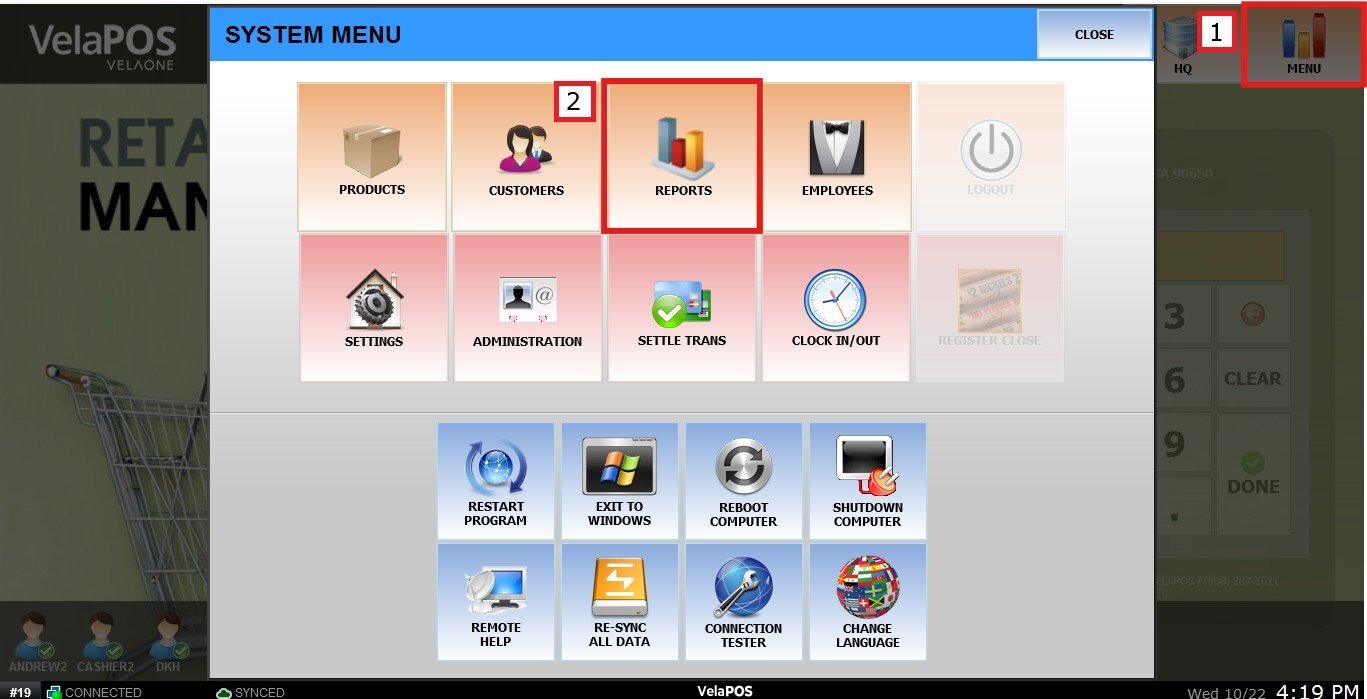
Go to SALES, then DISCOUNTS.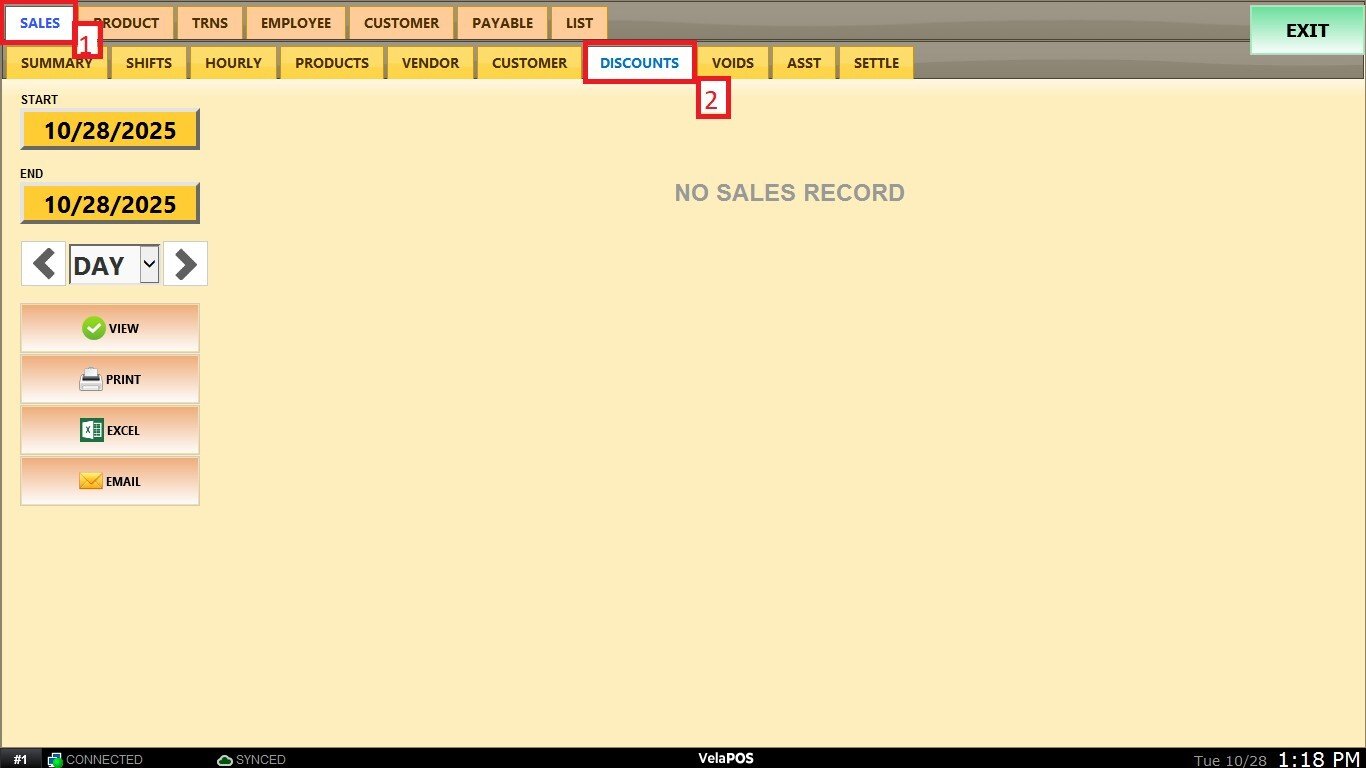
Filters
You can choose how you want the report to be grouped.
1. Filter by customized range: To view the report, within a specific date range. Press the START field to input the starting date.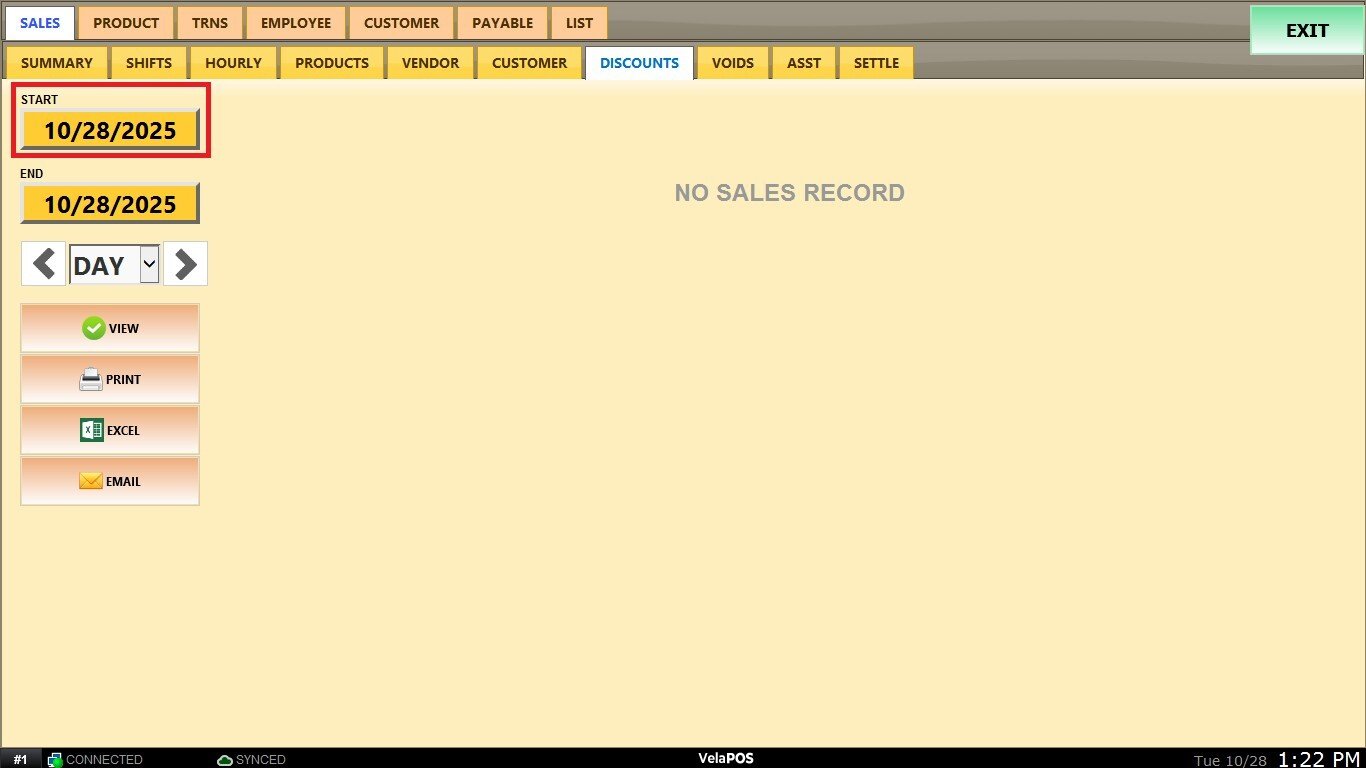
A calendar screen appears where you can select the date (day, month and year).
Press on DONE to confirm.
Repeat the same process for the END field to define the end date of your report.
2. Filter by a time frame: You can filter the report by predefined time frames (day, week, month, quarter, year).
Press on the field and select the time duration of your choice.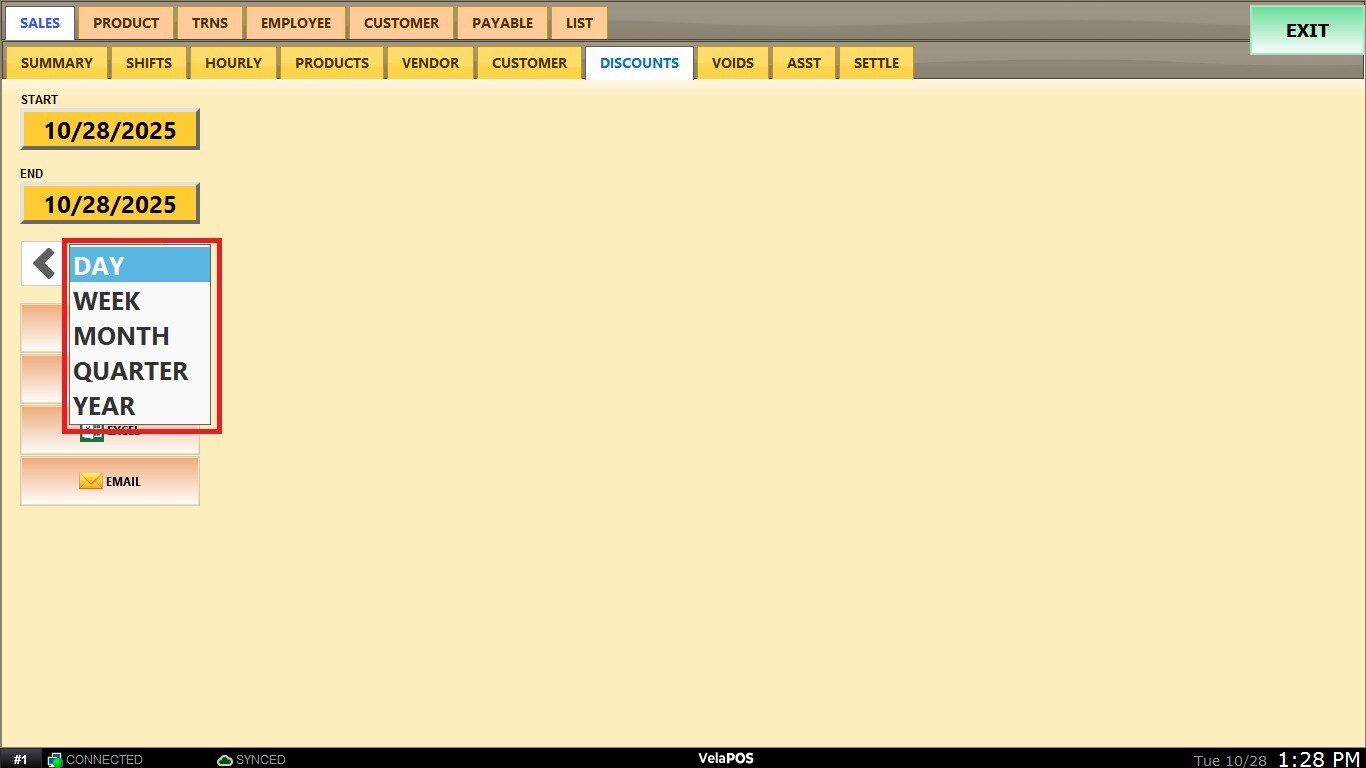
Use the side arrows to move forward or backward through the selected time periods.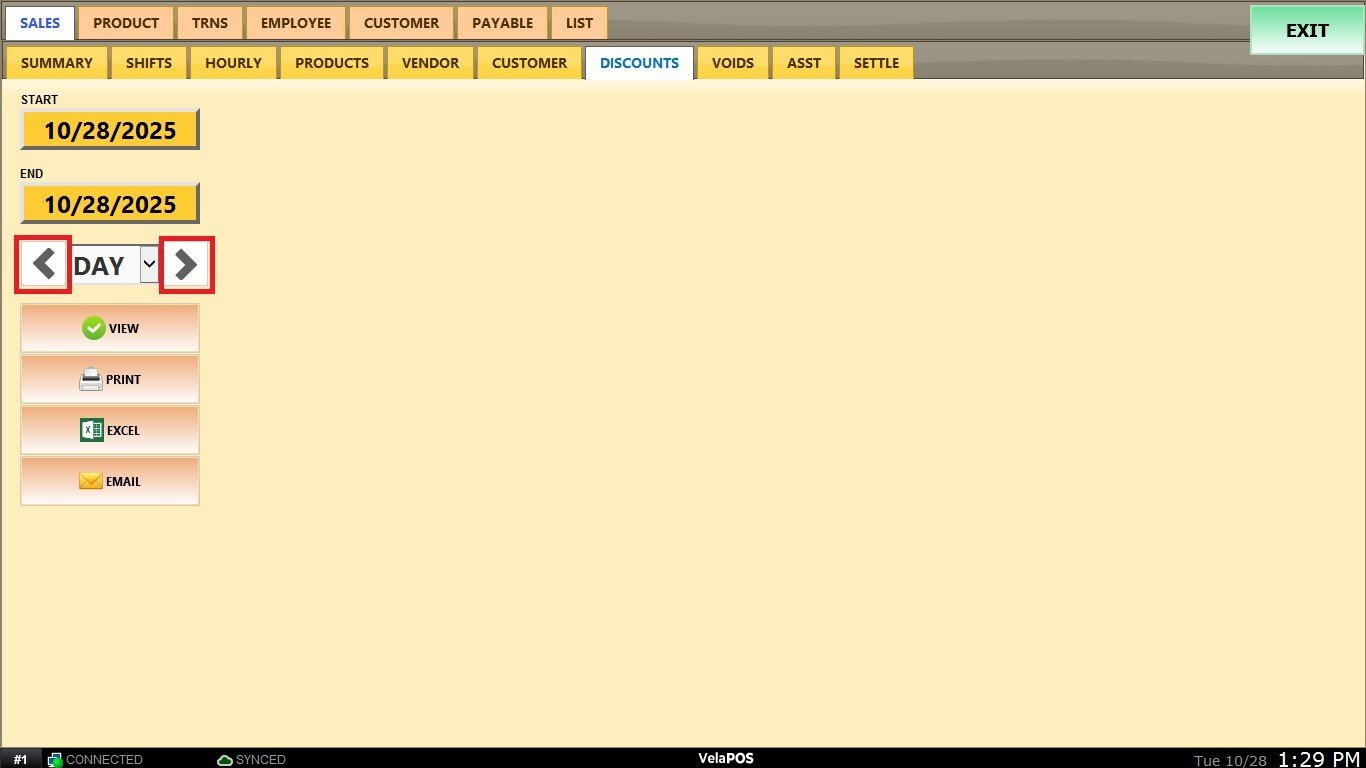
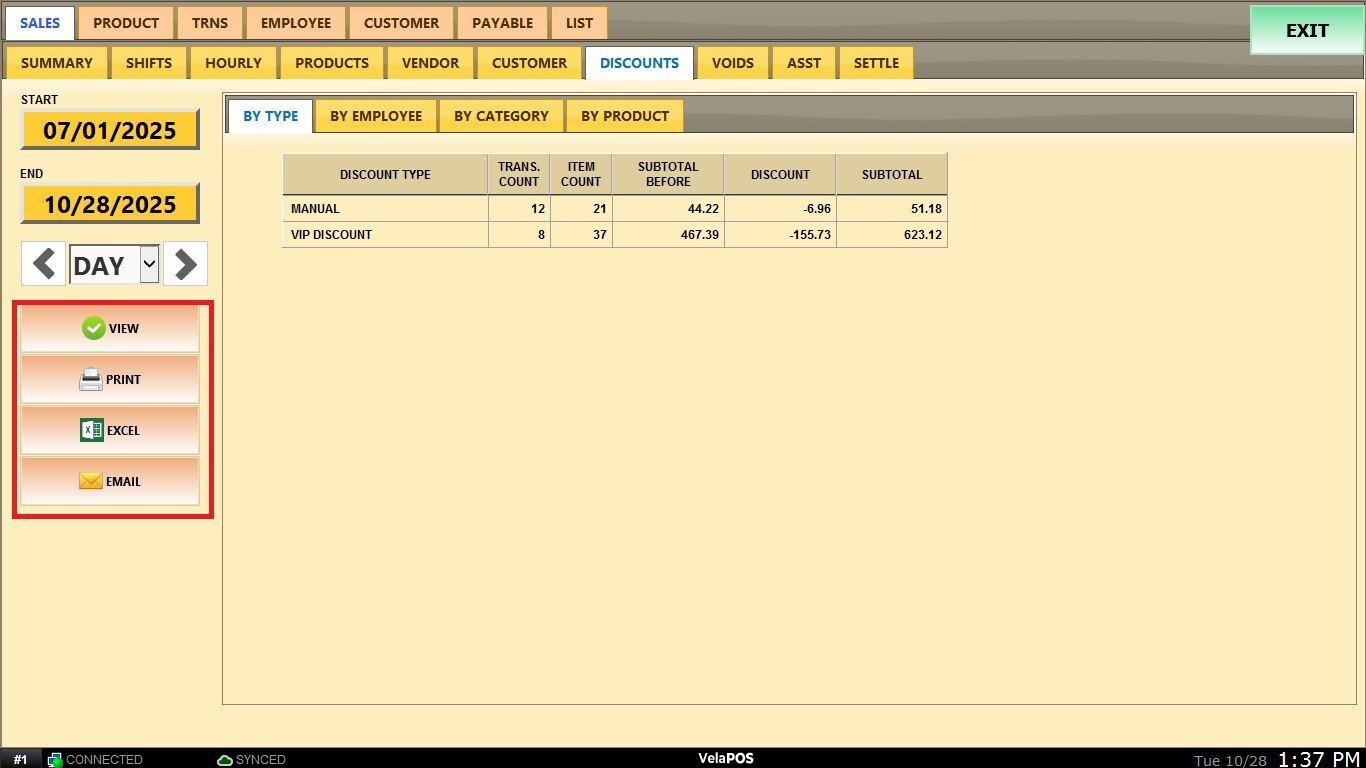
View
After setting the date range or time frame, press VIEW to display the report based on your selections. 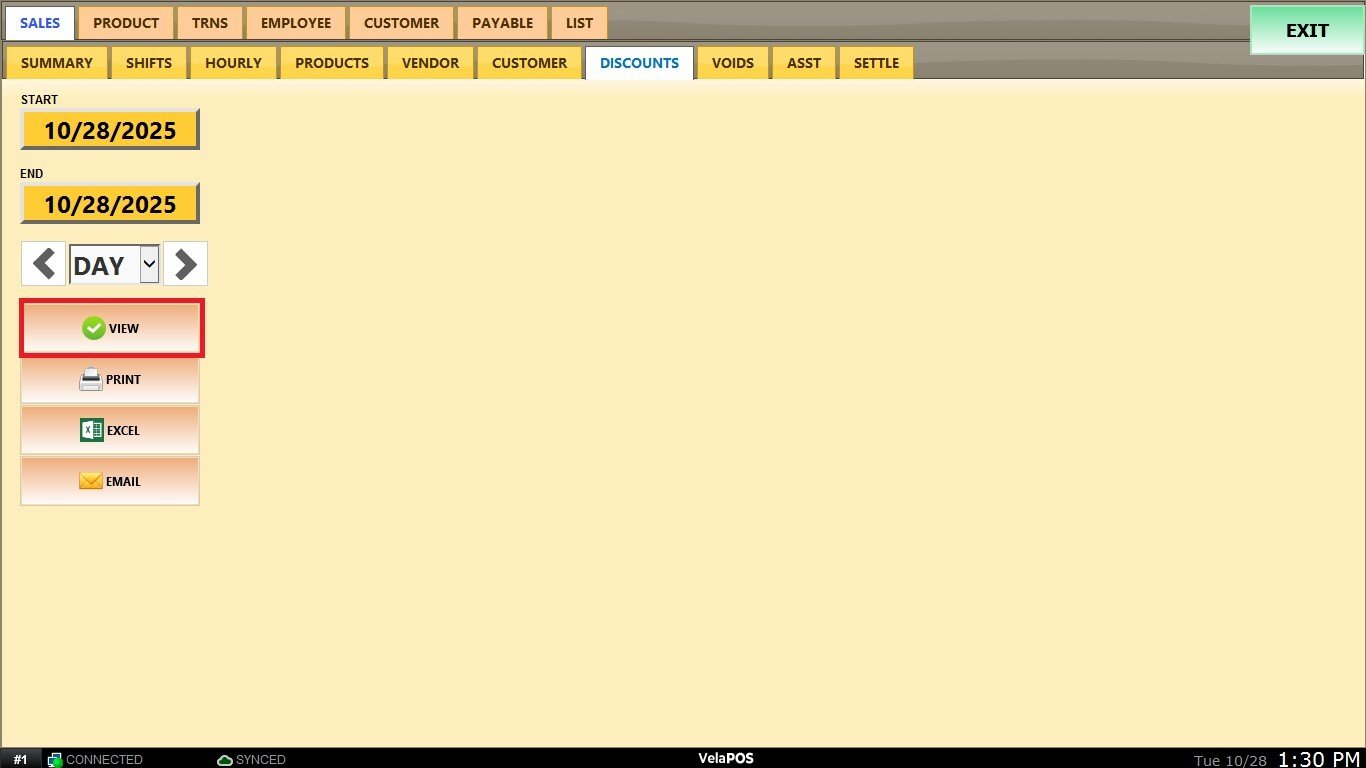
When you click on VIEW, the system will display four tabs that provide a detailed breakdown of the discount data.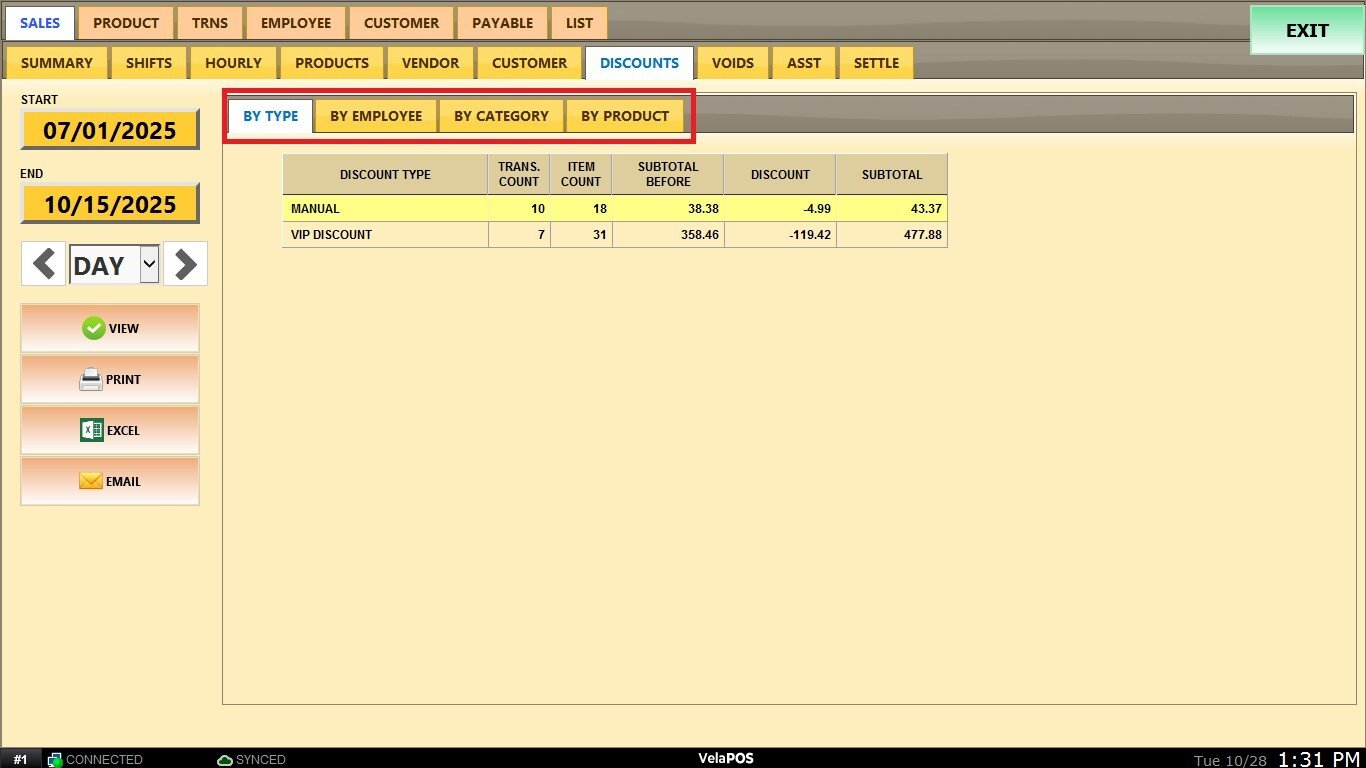
BY TYPE:
Shows discounts grouped by discount type and name (e.g., VIP, Manual, etc.).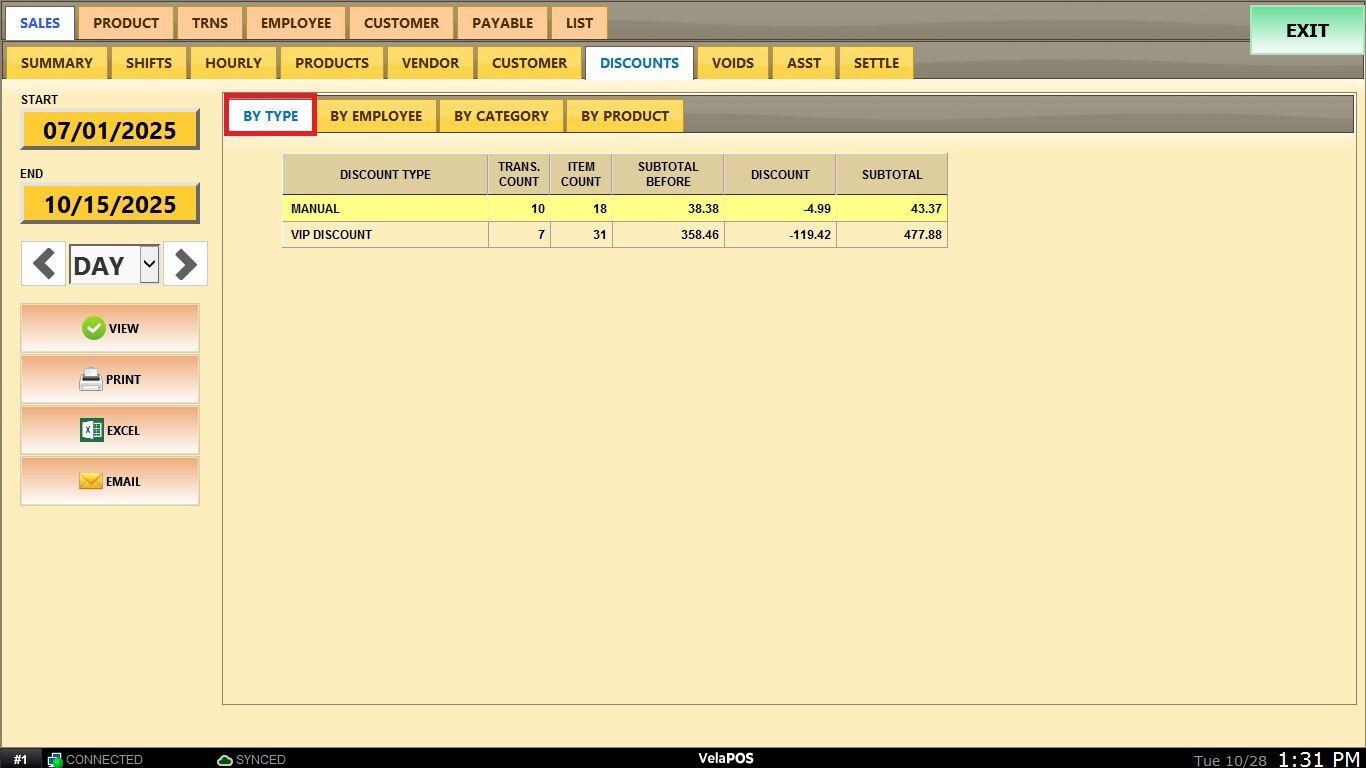
BY EMPLOYEE:
Shows discounts applied by each employee, helping track usage and monitor performance.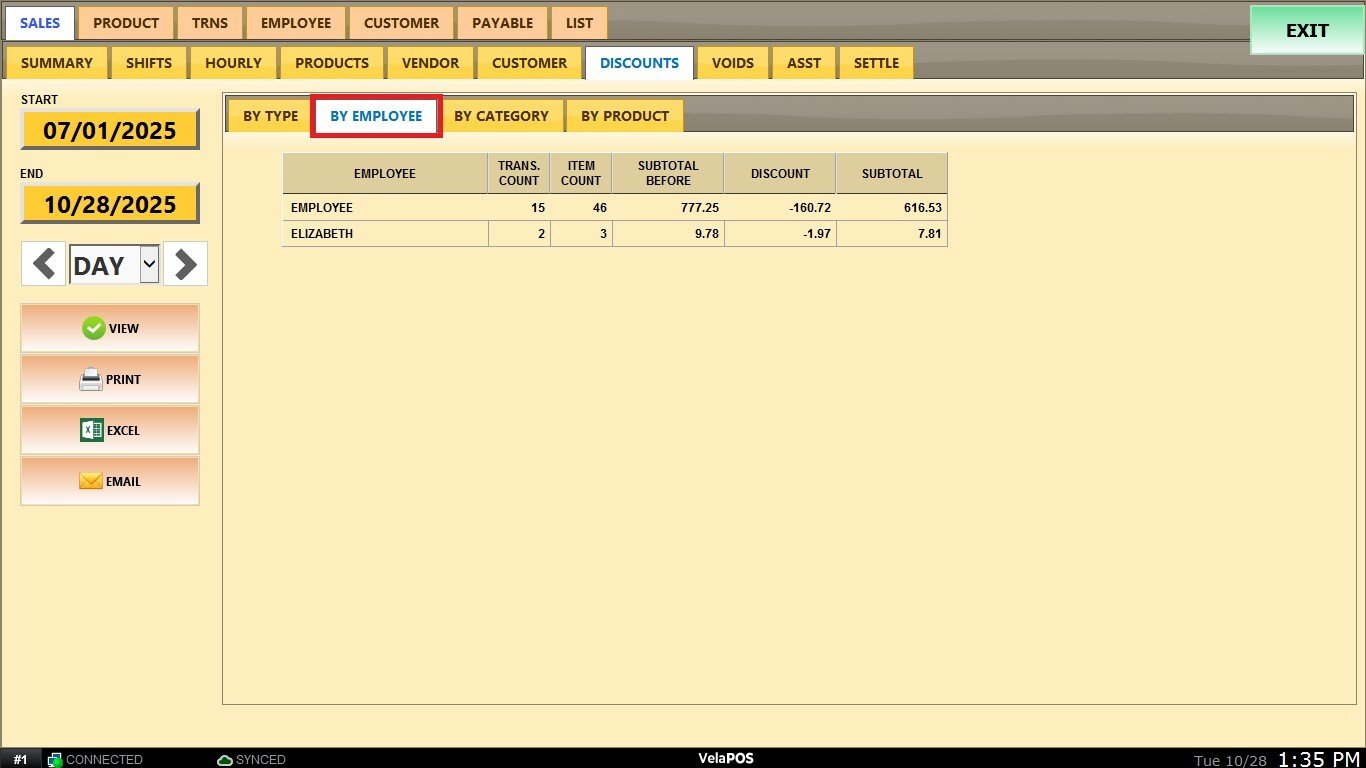
BY CATEGORY:
Summarizes discounts by product category to identify which categories receive the most discounts.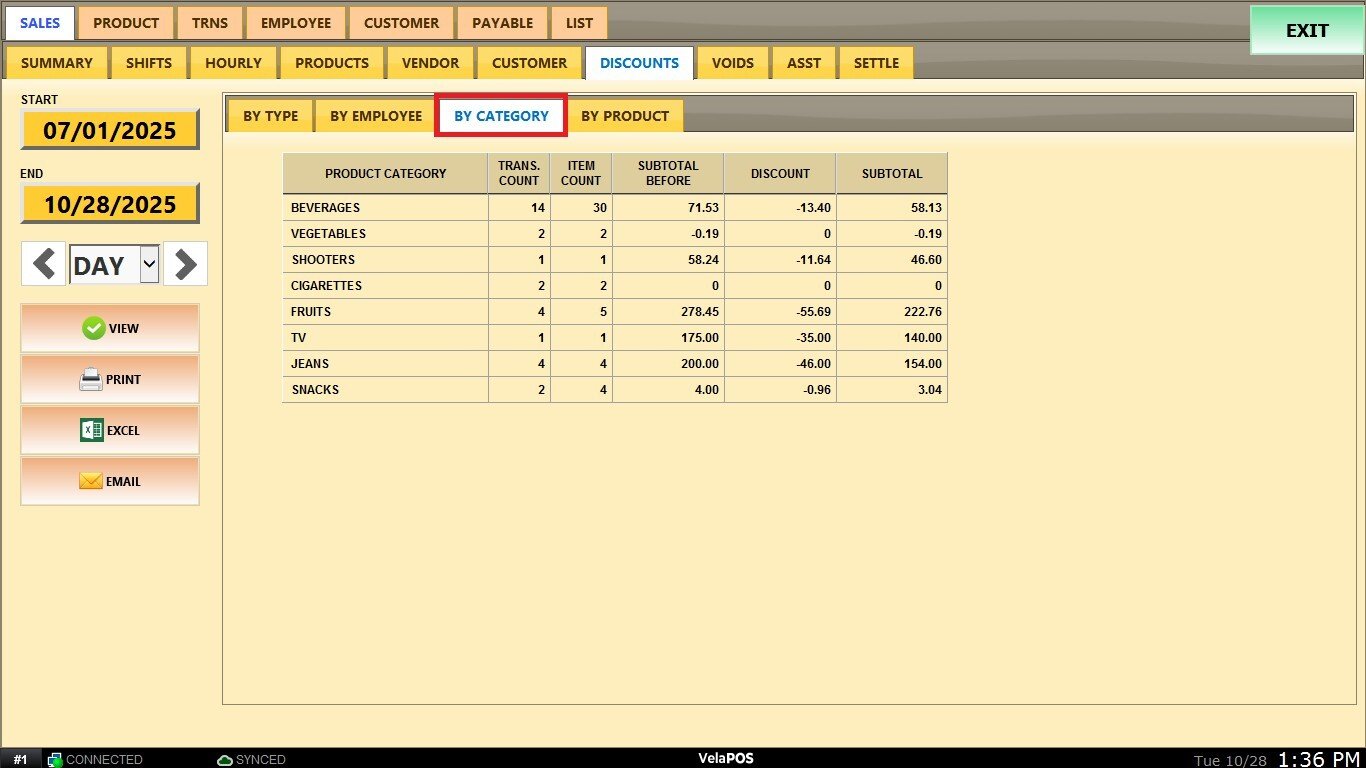
BY PRODUCT:
Summarizes discounts by product to identify which products receive the most discounts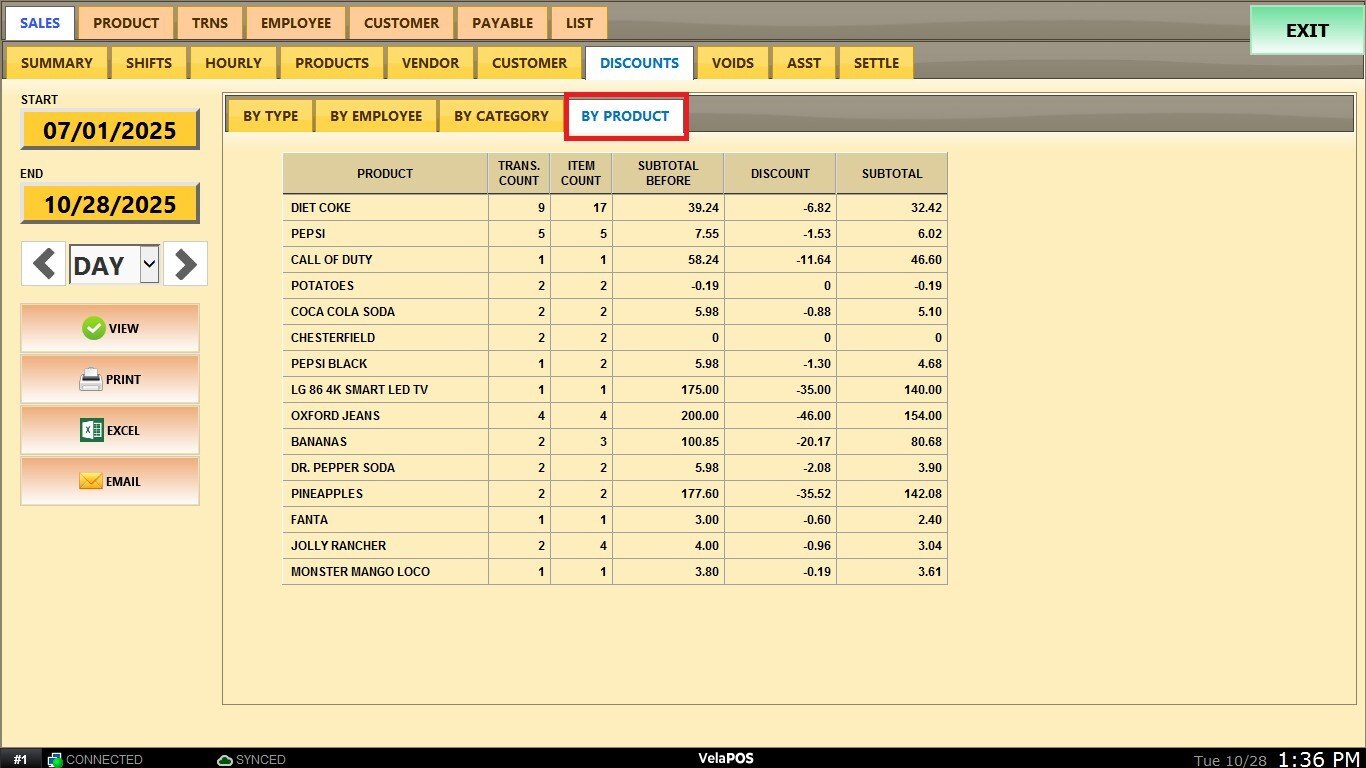
You can PRINT, EXPORT to EXCEL, or EMAIL the report.