Hourly
This report shows an hourly breakdown of sales, helping you pinpoint your busiest and slowest hours, along with the quantity sold and total revenue for each time slot.
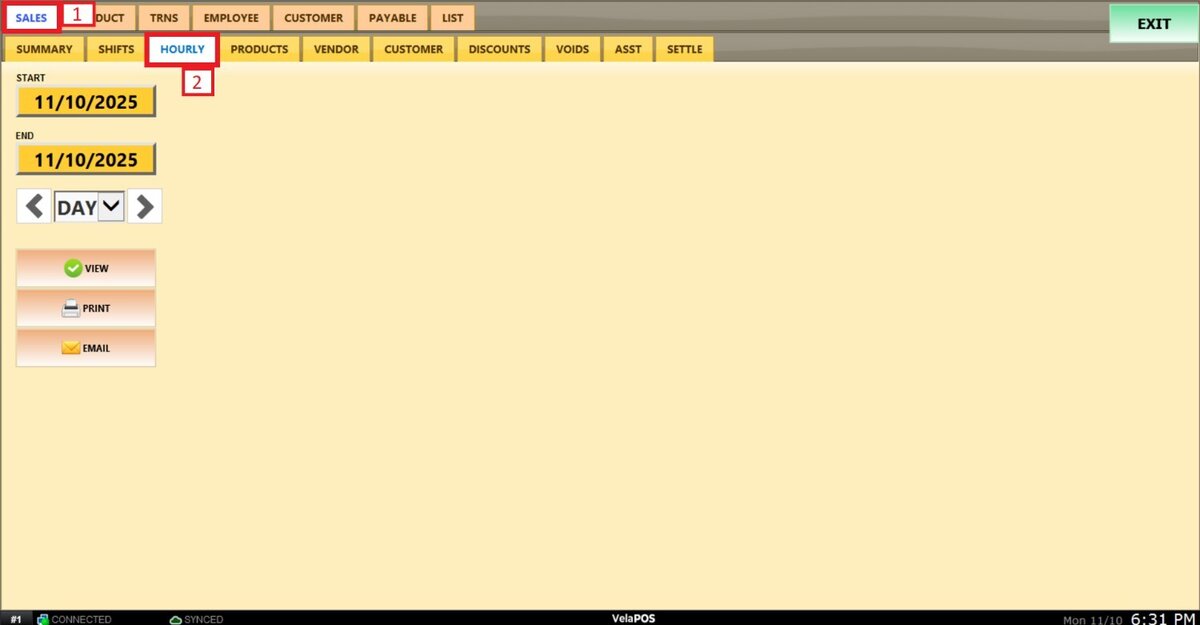
Main Screen> MENU> REPORTS> SALES> HOURLY
From the Main Screen, open MENU and go to REPORTS.

Under SALES, select the HOURLY tab.
Filters
Use the filters to define how the report is grouped and displayed.
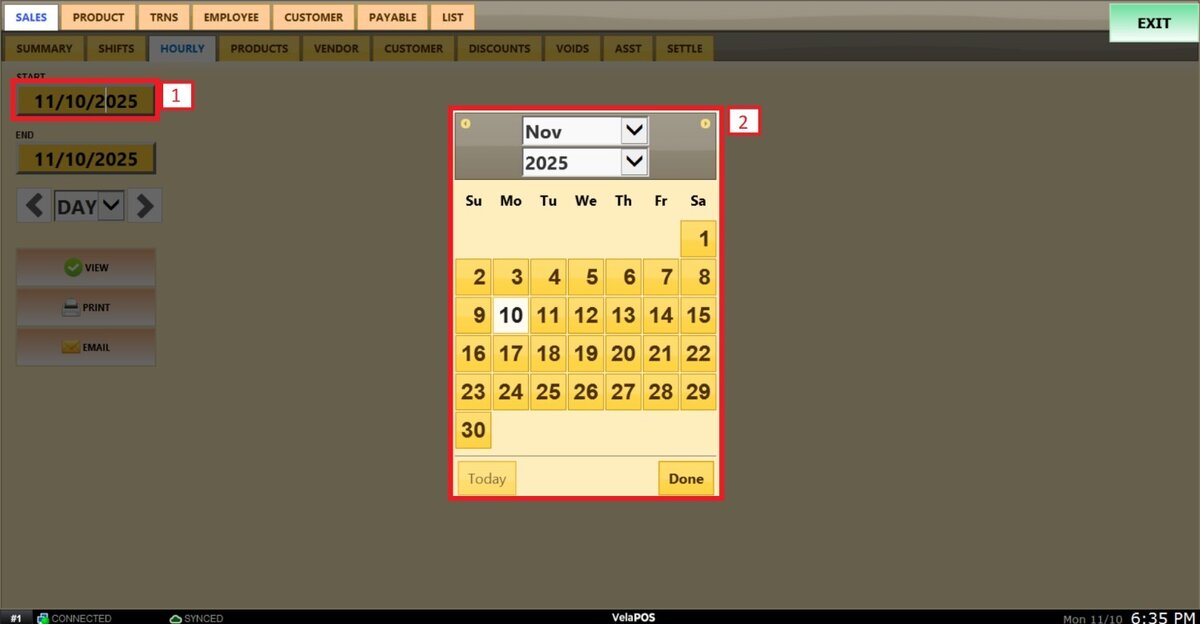
1. Filter by customized range: to view the report, begin by selecting its date range. Press on the START field to input the starting date.
A calendar screen appears where you can select the date (day, month and year).
Press on DONE.
Repeat the same process for the END field to set the final date of your report.
2. Filter by a time frame: You can filter the report by time frame (day, week, month, quarter, year).
Press on the field and select the time duration of your choice.
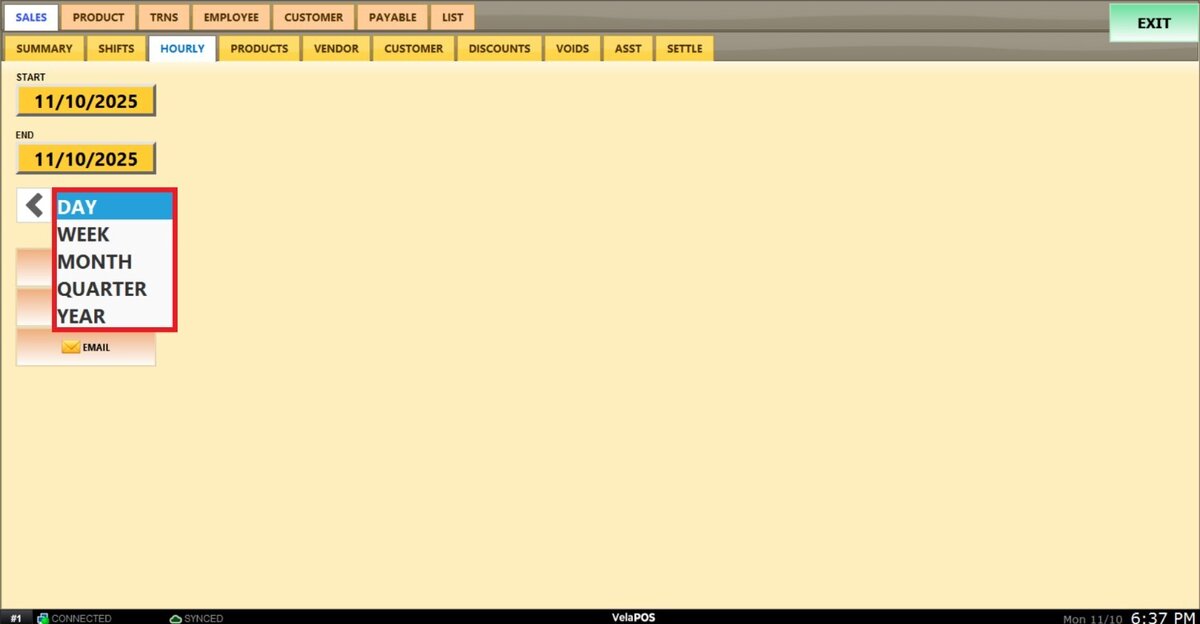
Use the side arrows to move forward or backward through the selected time periods.

Click on VIEW to apply the filters and generate the report.

View
The report will show the number of visitors per hour, the quantity of items sold, and the total revenue for each hour.

You can PRINT or EMAIL the hourly sales breakdown.
