Daily Total
This report displays a summary of daily sales within a selected date range. It provides an overview of total transactions, sales amounts, payment types, and other key details, allowing you to track daily performance and identify sales trends over time.
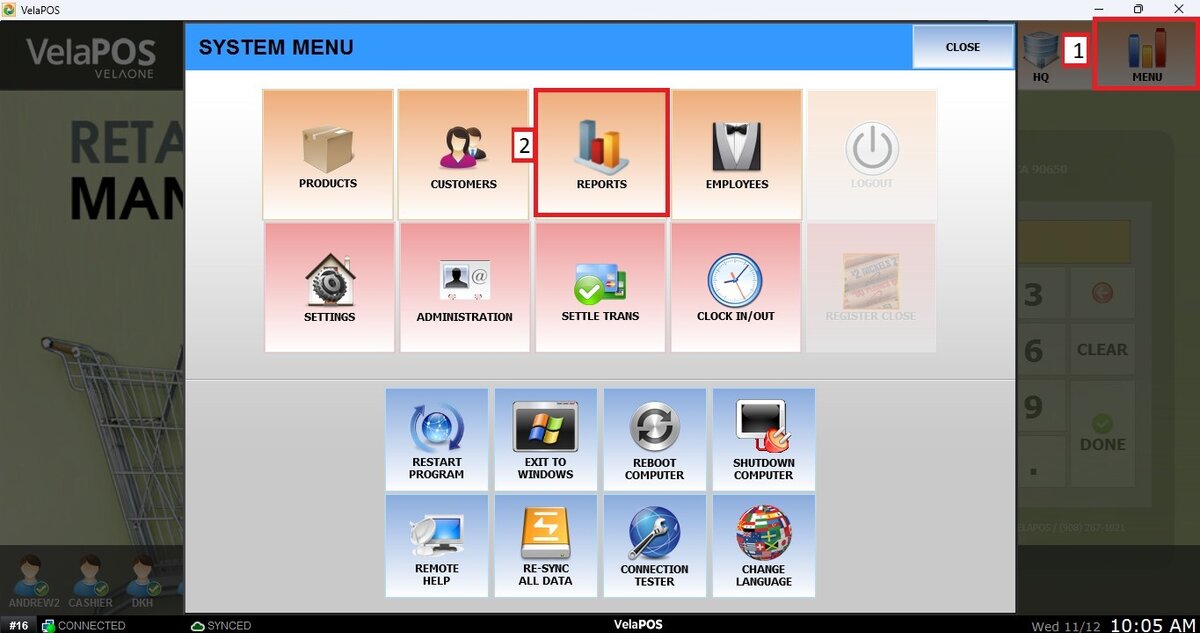
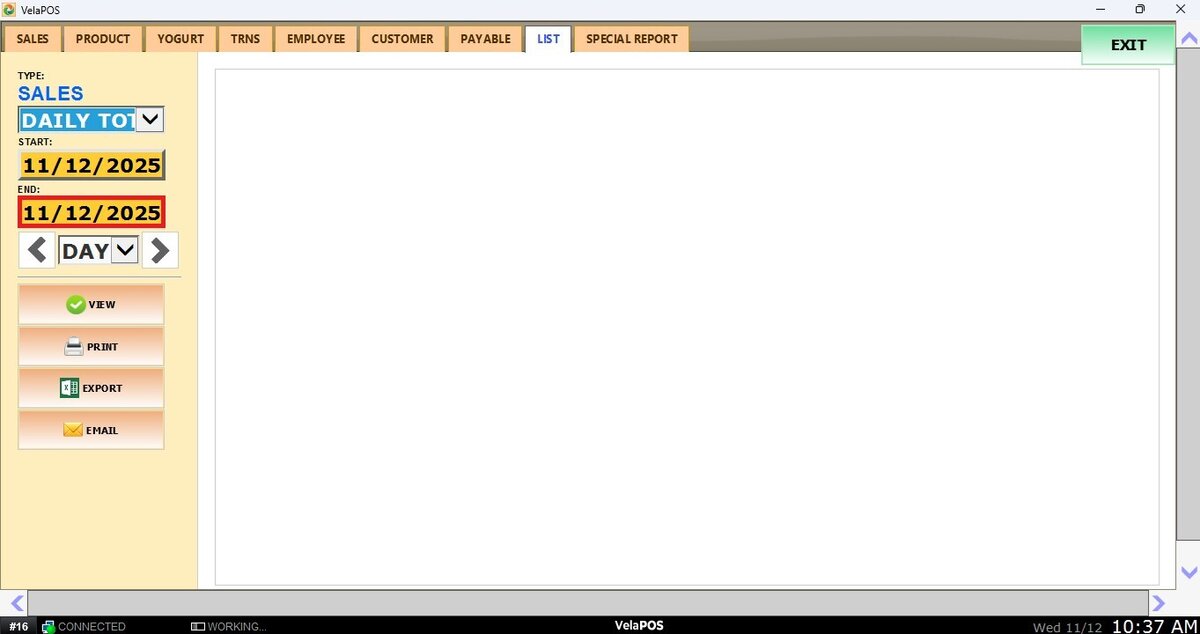
Main Screen> MENU> REPORTS> LIST
Go to MENU and press REPORTS.
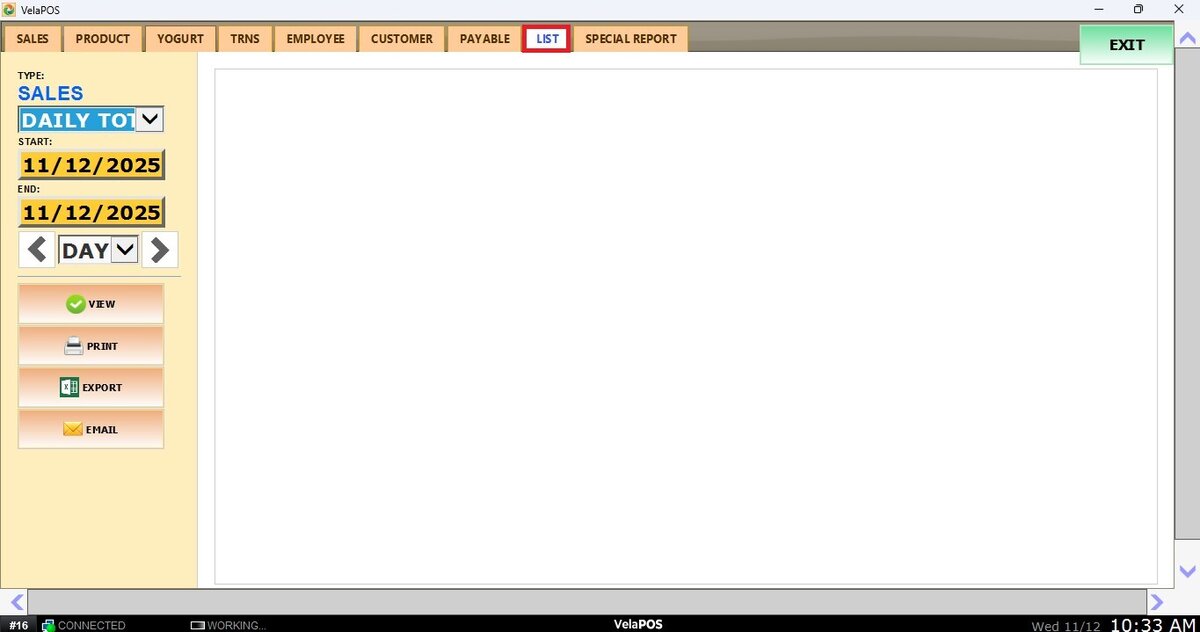
Press the LIST tab.
Filters
You can choose how you want the report to be grouped.
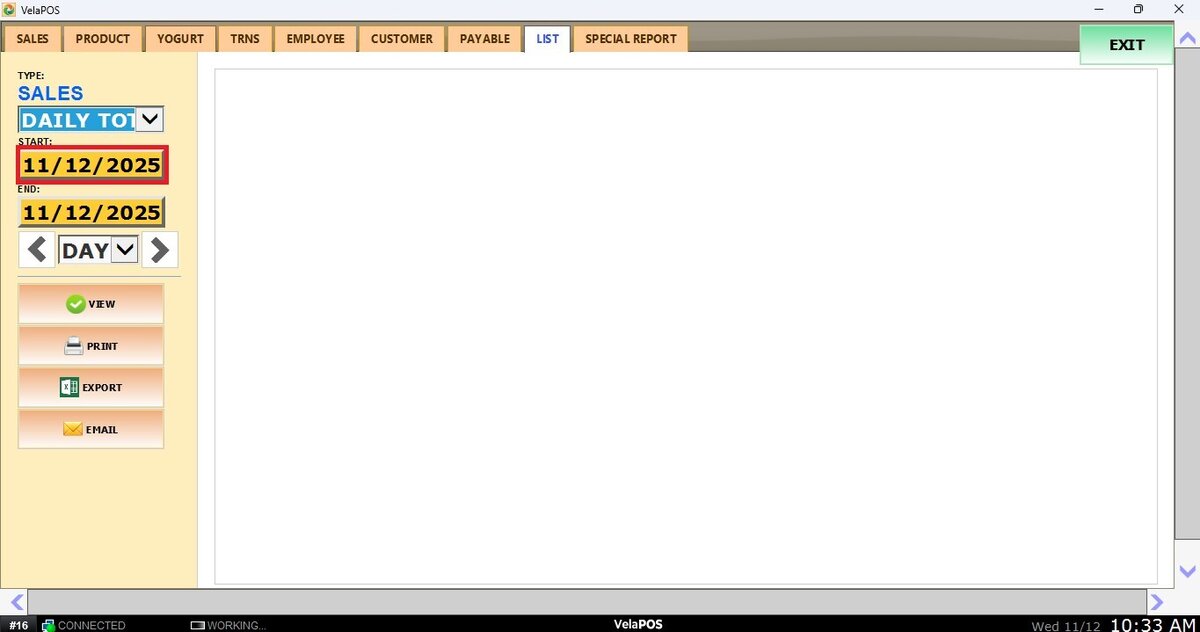
1. Filter by customized range: to view the report, begin by selecting its date range. Press on the START field to input the starting date.
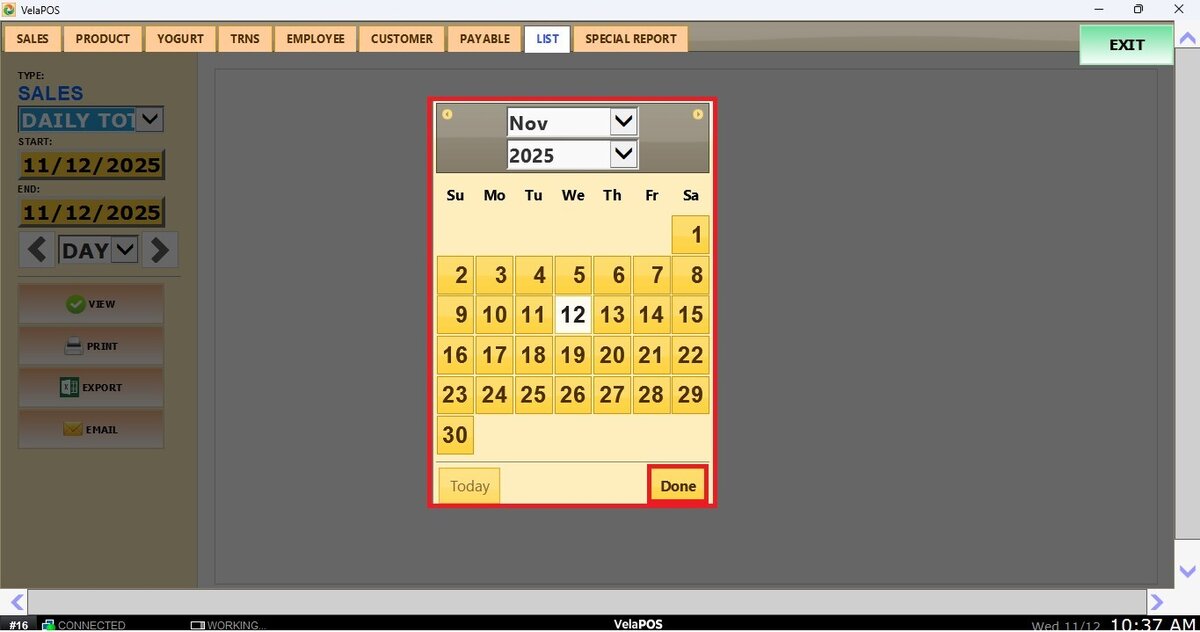
A calendar screen appears where you can select the date (day, month and year).
Press on DONE.
Repeat the same process for the END field to set the final date of your report.
2. Filter by a time frame: you can filter the report by time frame (day, week, month, quarter, year).
Press on the field and select the time duration of your choice.
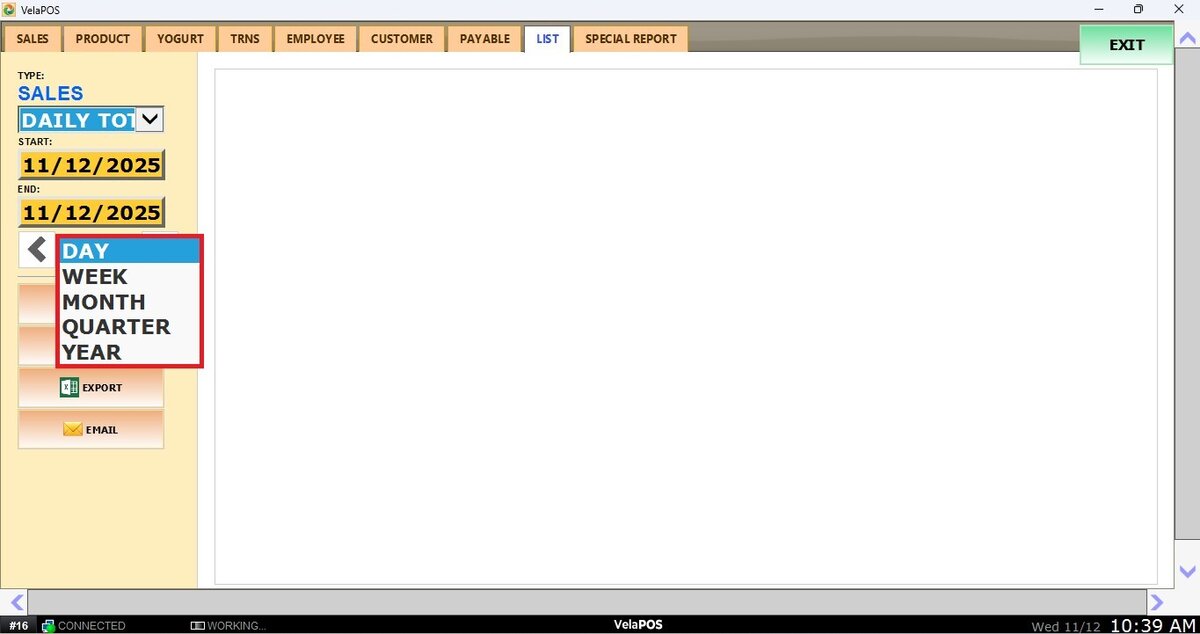
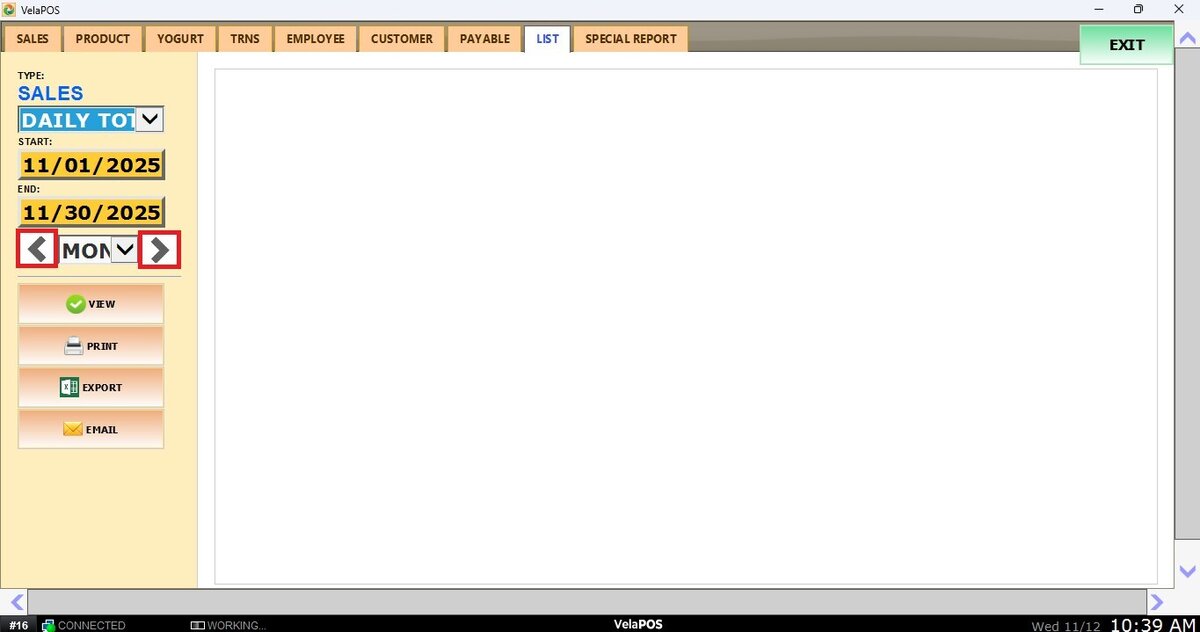
Depending on whether you select Day, Week, Month, Quarter, or Year you can use the side arrows to move forward or backward through those time periods.
View
After setting the timeframe, press VIEW to display the report. Once displayed, you can PRINT it, EXPORT TO CSV FILE or EMAIL it.
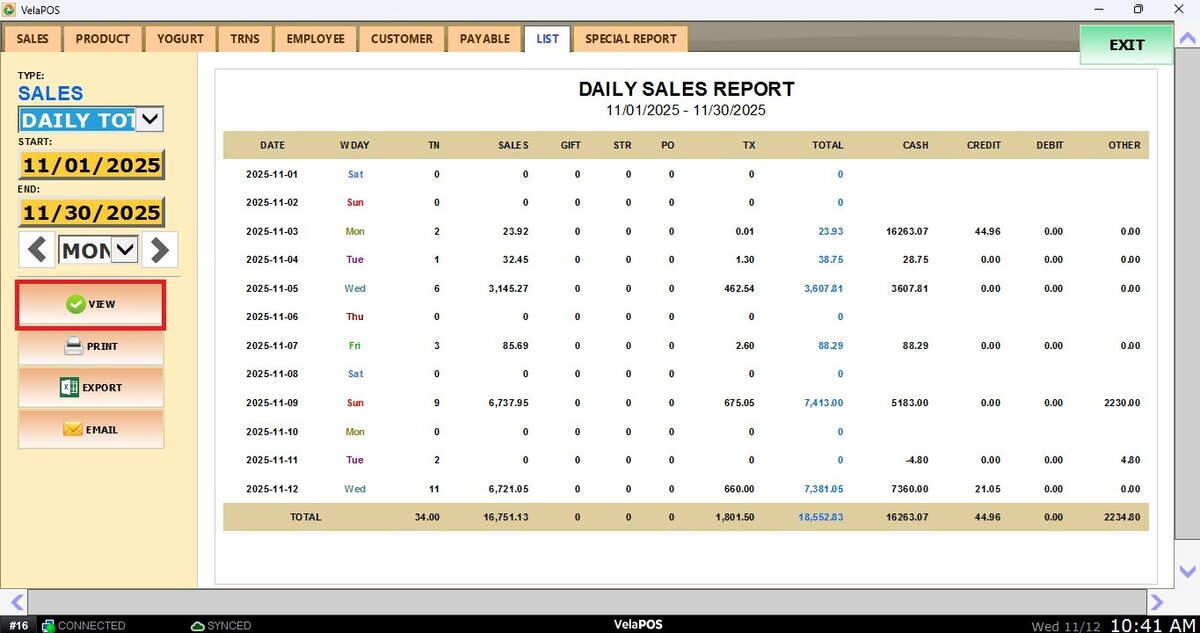
This report includes the following columns:
DATE: Displays the specific date the sales were recorded.
WDAY: Indicates the day of the week (Mon, Tue, Wed, etc.).
TN: Shows the total number of transactions processed on that day.
SALES: Represents the total amount of product sales (regular sales, excluding tips, fees, or other charges).
GIFT: Amount collected from gift card sales.
STR: Shows the amount processed using store credit, if this feature is used by the business.
PO: Displays payouts or cash removed from the register, such as vendor payments or minor expenses.
TX: Indicates the total tax generated from sales for that day.
TOTAL: The full amount paid by customers, including sales, tax, and other applicable charges.
CASH, CREDIT, DEBIT, OTHER: Display the total amounts collected through each payment method, including any additional tender types such as EBT.