Products
This report provides a detailed breakdown of the items sold. It is essential for tracking product performance and profitability.
Main Screen> MENU> REPORTS> SALES> PRODUCTS
Go to MENU and press PRODUCTS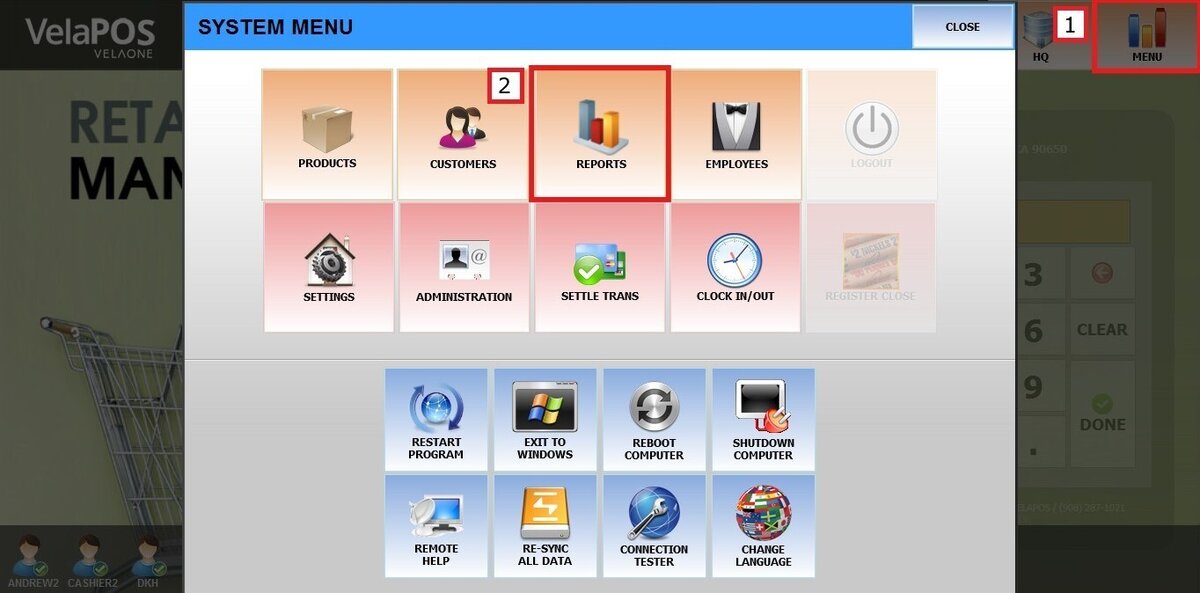
On the reports section, go to SALES and PRODUCTS.

FILTERS
You can choose how you want the report to be grouped.
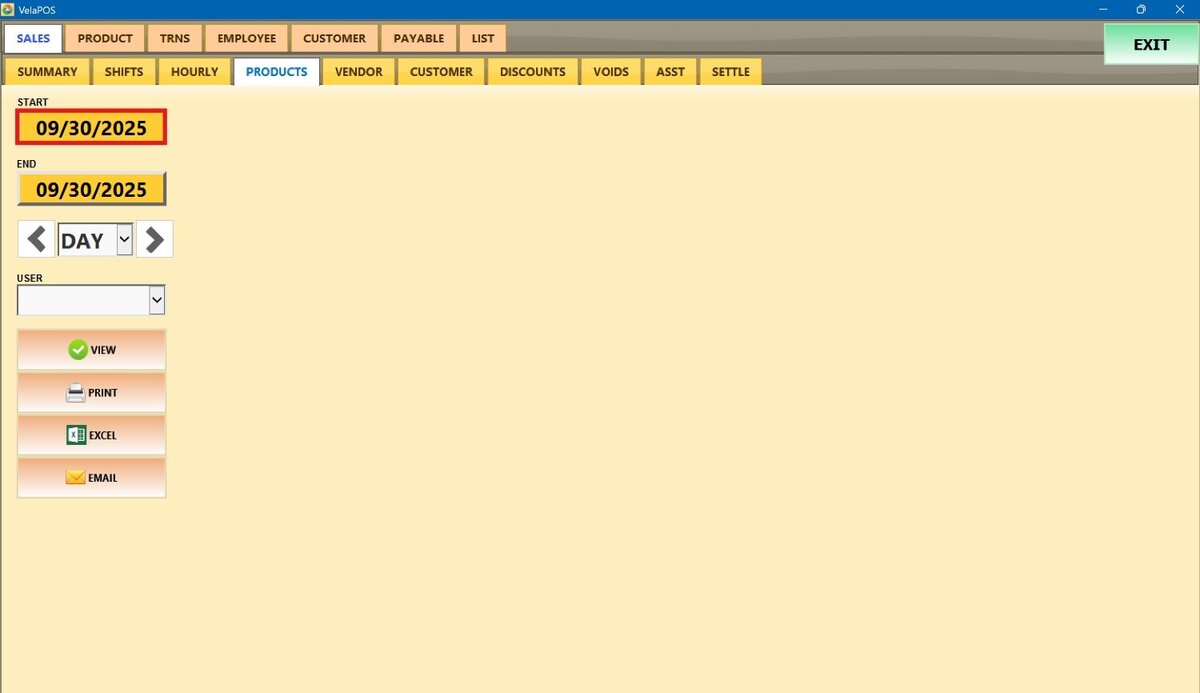
1. Filter by customized range: to view the report, begin by selecting its date range. Press on the START field to input the starting date.
A calendar screen appears where you can select the date (day, month and year).
Press on DONE.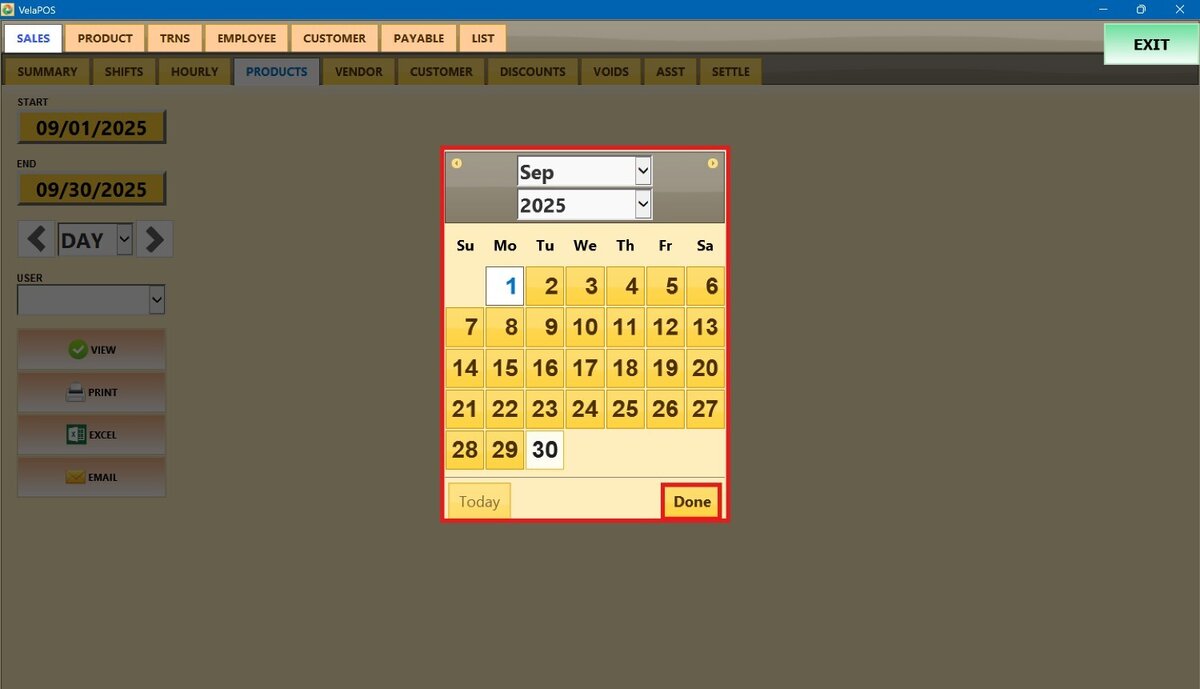
Repeat the same process for the END field to set the final date of your report.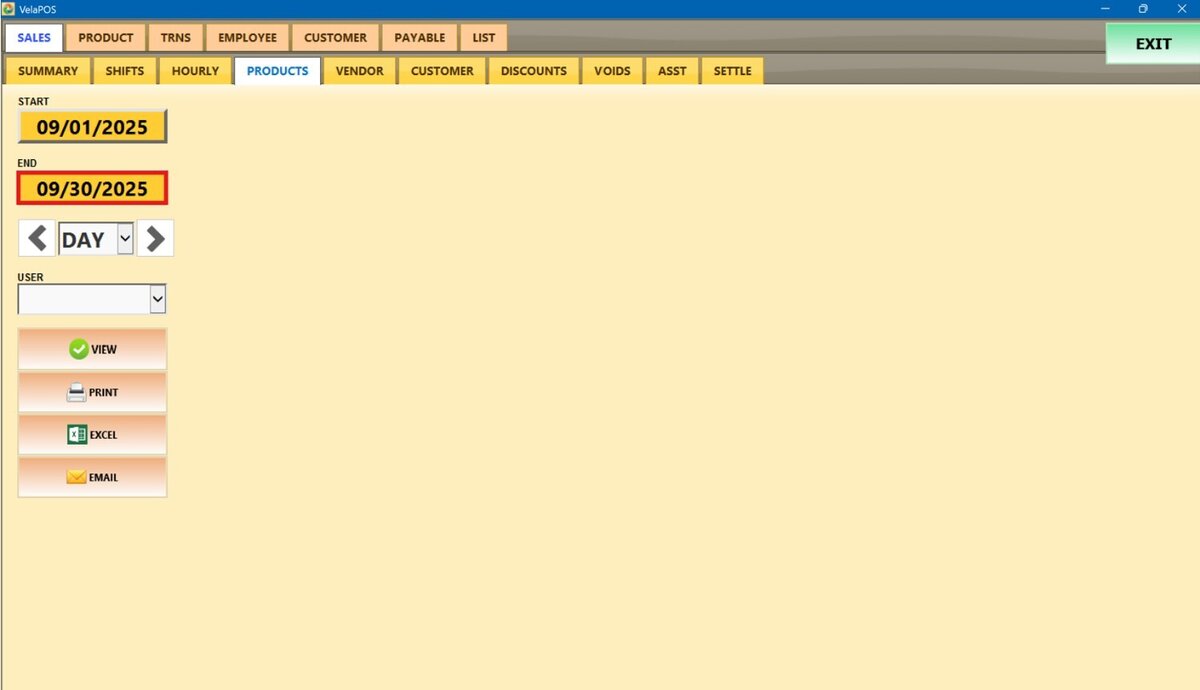
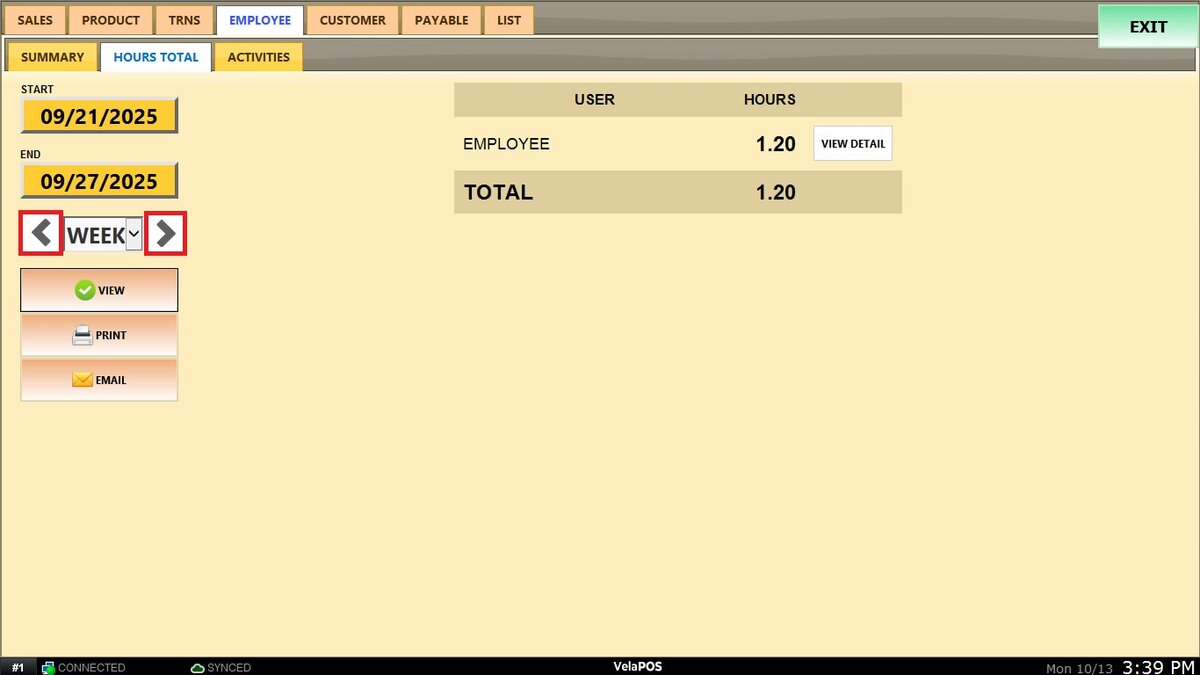
2. Filter by a time frame: you can filter the report by time frame (day, week, month, quarter, year). Press on the field and select the time duration of your choice.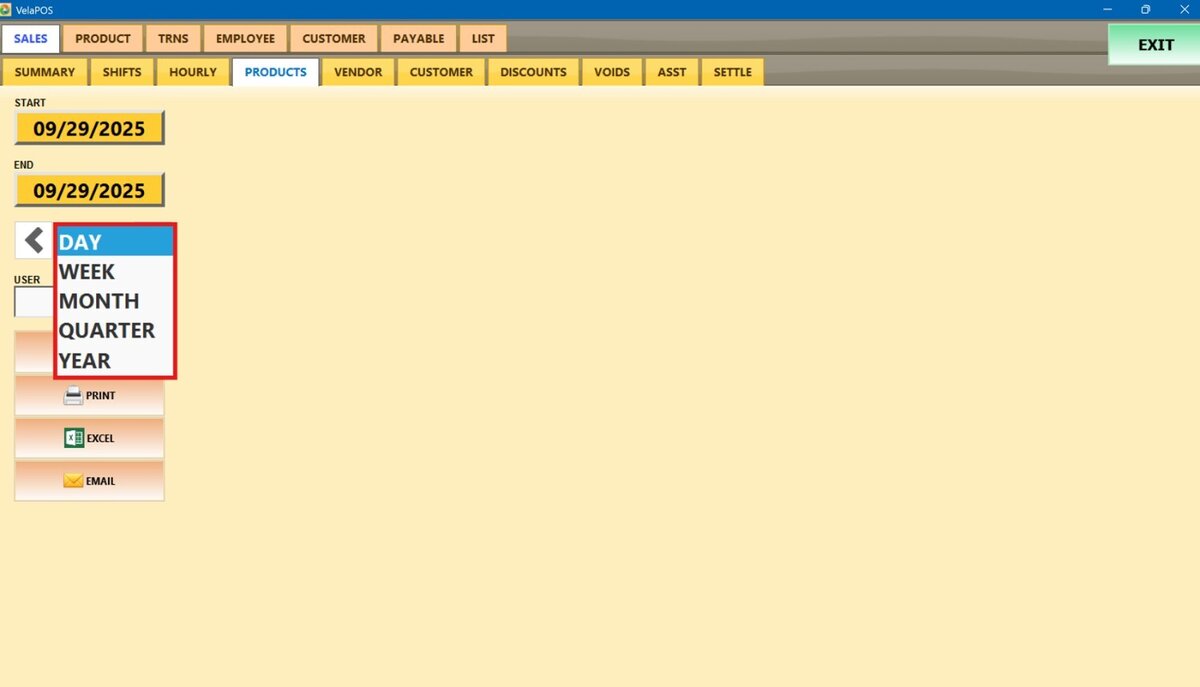
Depending on whether you select Day, Week, Month, Quarter, or Year you can use the side arrows to move forward or backward through those time periods.
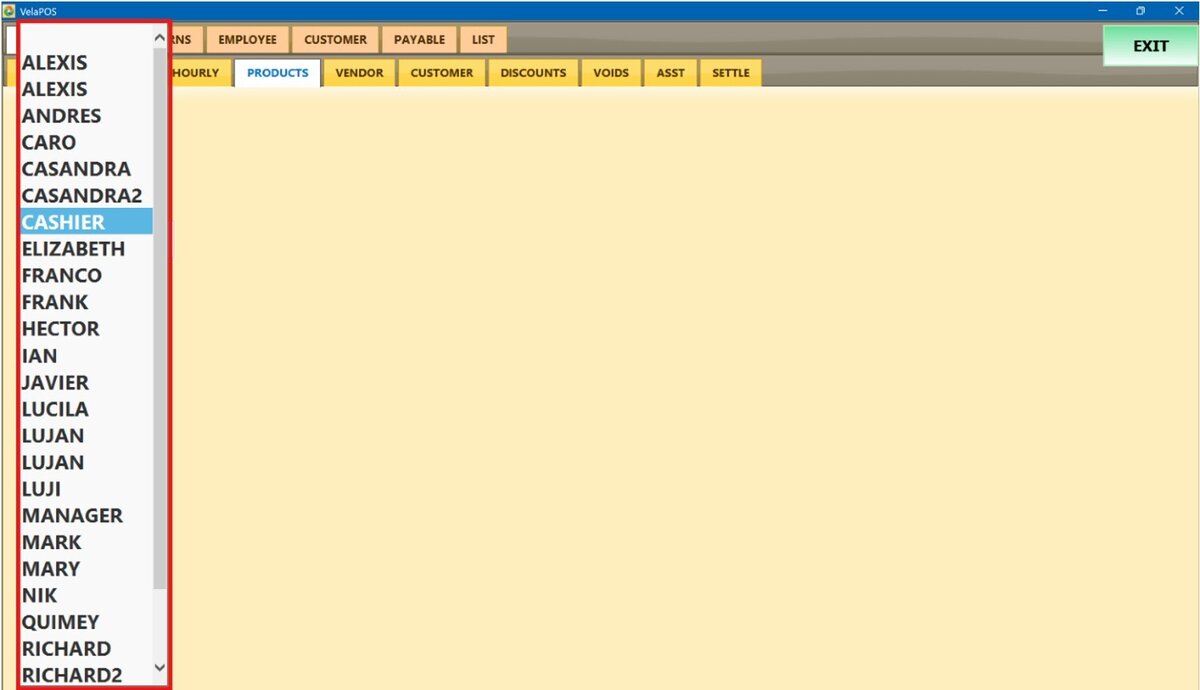
3. By User (employee): press on the USER field and select the staff member.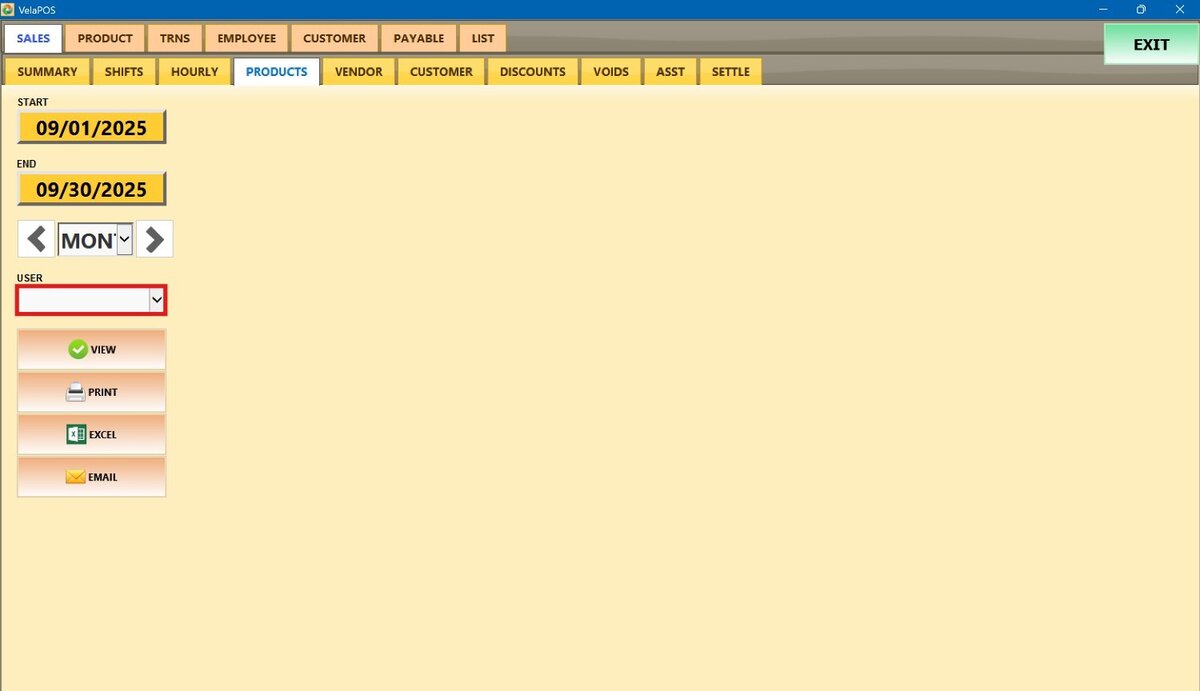
VIEW
After setting the date range, time frame, and user filter, press VIEW to display the report based on your selections.
When pressing VIEW, the system displays three tabs, each offering a different view of the product information: ALL LIST, BY DEPARTMENTS, and NOT SOLD.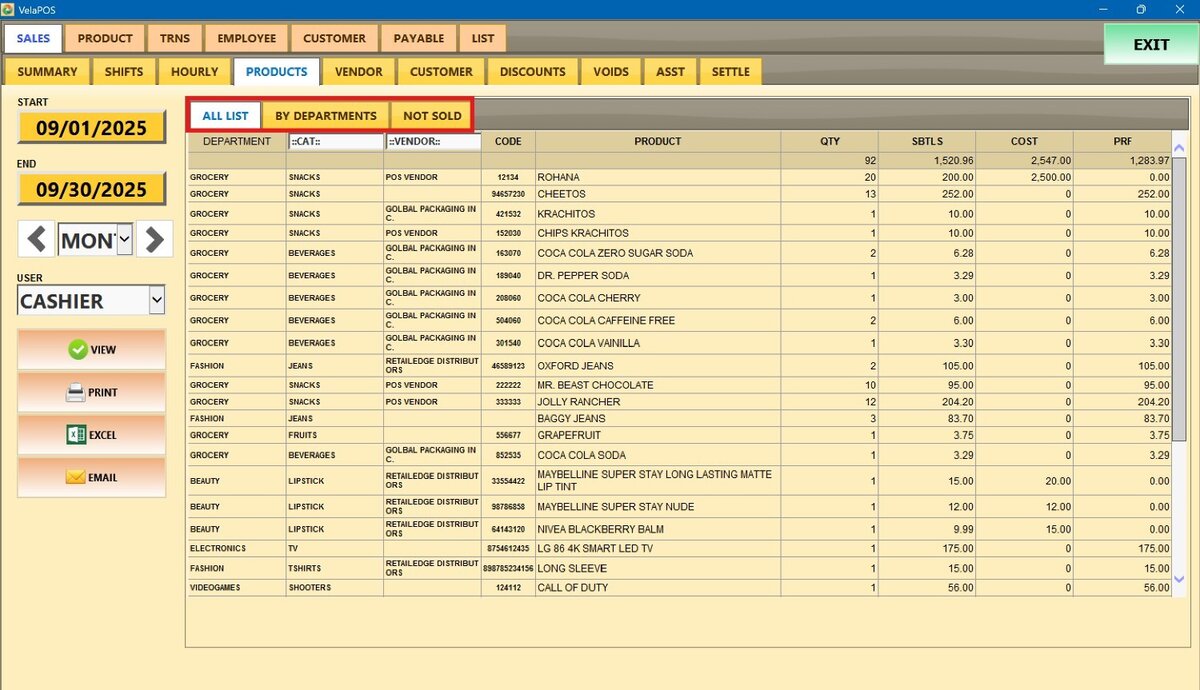
All List
It displays all items across departments, regardless of sales status and includes quantity, subtotal, cost, and profit.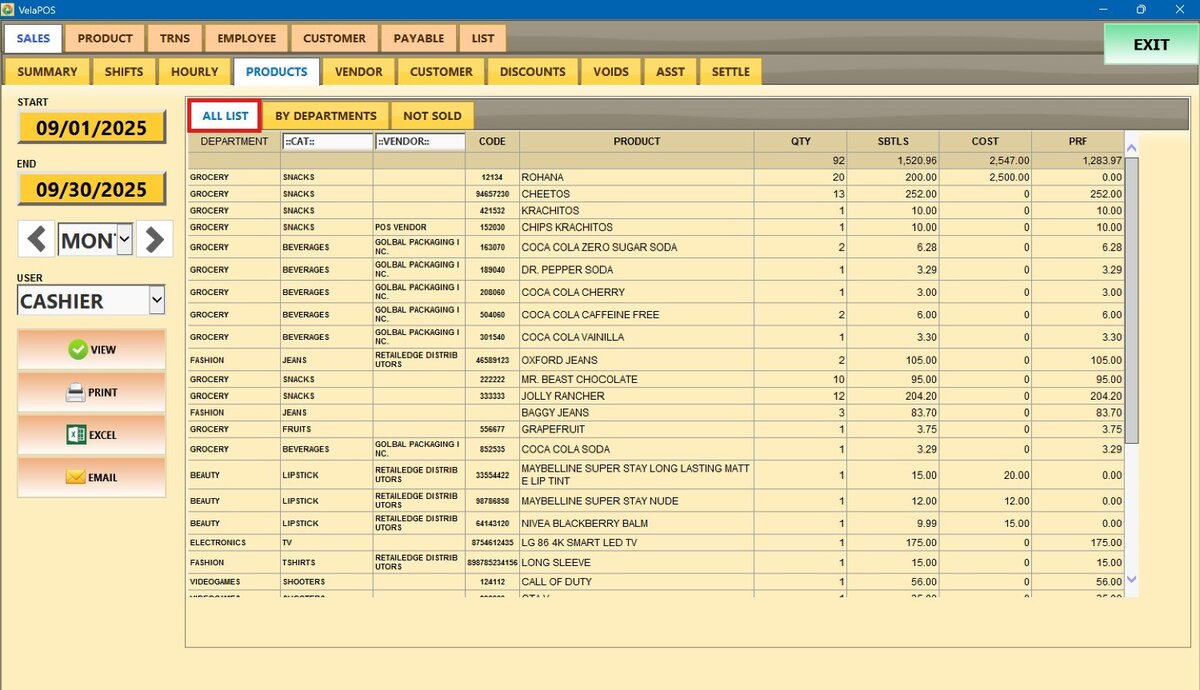
Press on the CAT. drop-down menu to narrow the report by the type of product.
Press on the VENDOR drop-down menu to filter products that are supplied by a specific vendor.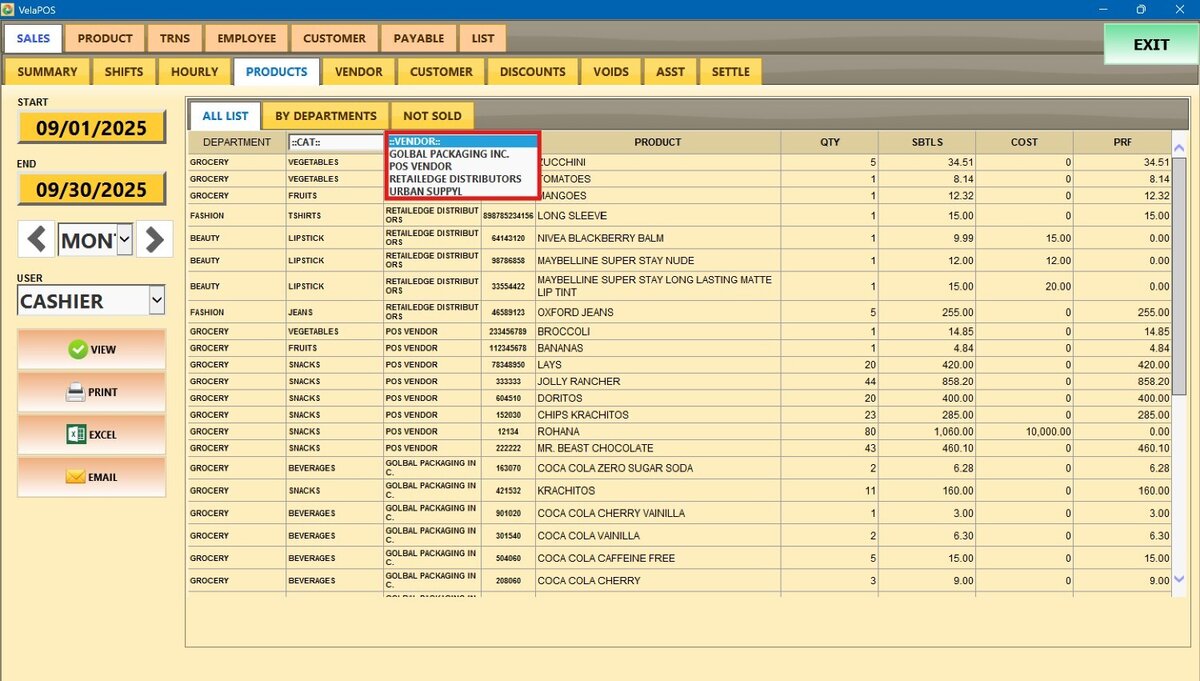
By Departments
It displays product sales by department. The report includes quantity sold, total sales, discounts applied, subtotal, average price, cost, and profit.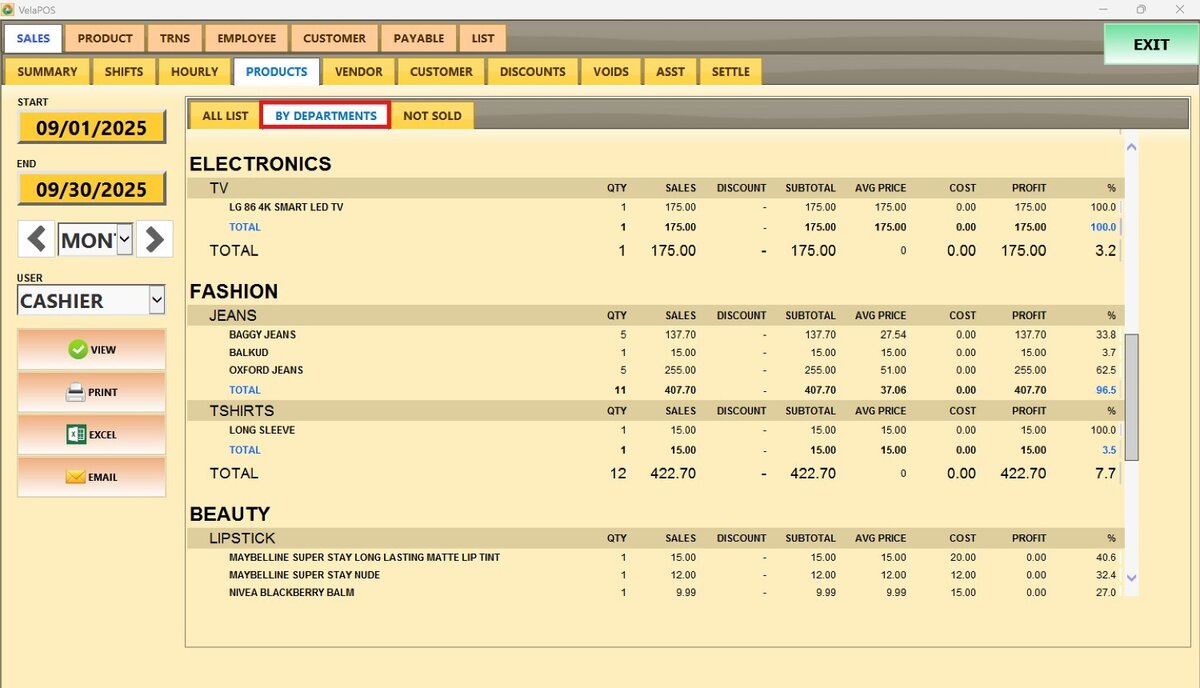
Not Sold
Displays the products that weren’t sold within the time frame selected. It includes key details such as department, category, vendor, product code, item name, price, and cost.
All the reports view, whether it's All List, By Departments, or Not Sold, include the options to PRINT, export to EXCEL, and to EMAIL it.