Report Tab
This report provides a detailed overview of a product's activity, allowing users to monitor the performance by organizing the data into four areas: SUMMARY, TRANSACTIONS, INVENTORIES, and COST ANALYSIS.
Main Screen > MENU> Product> Product's DETAIL> RPT Tab
Go to MENU and press PRODUCTS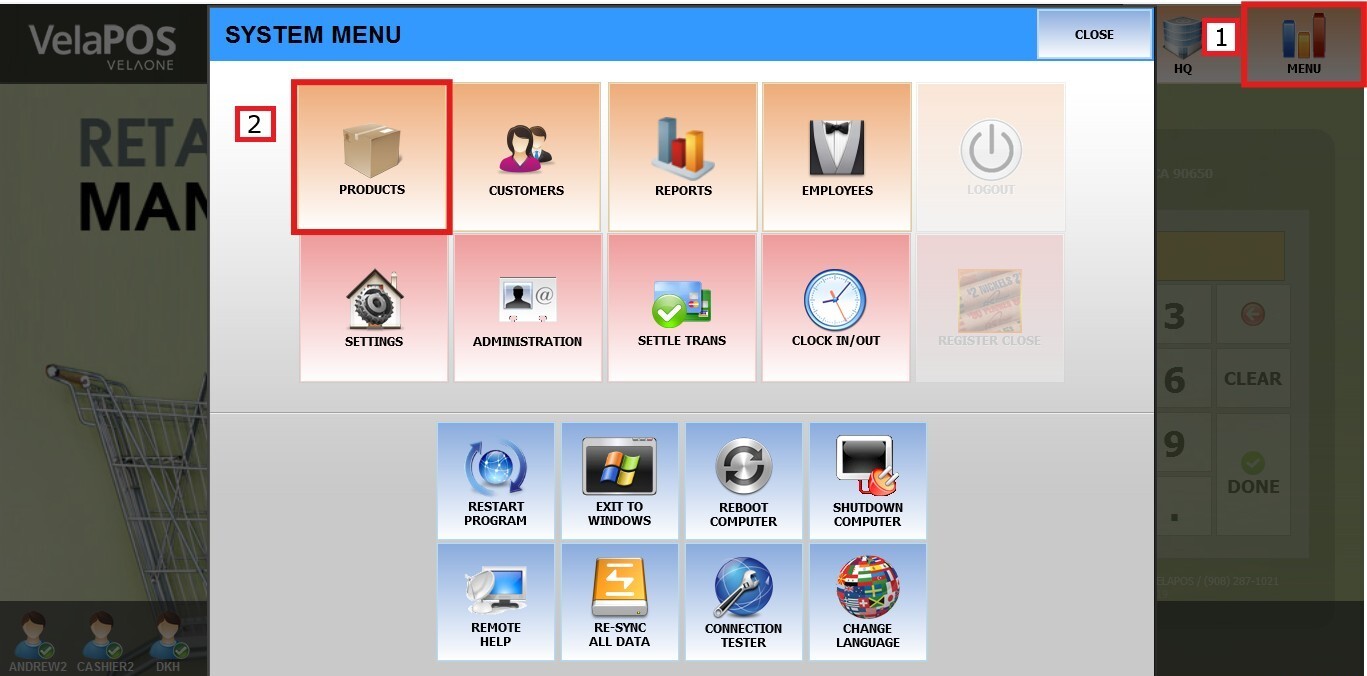
In the product section, search for an item and press on its DETAIL.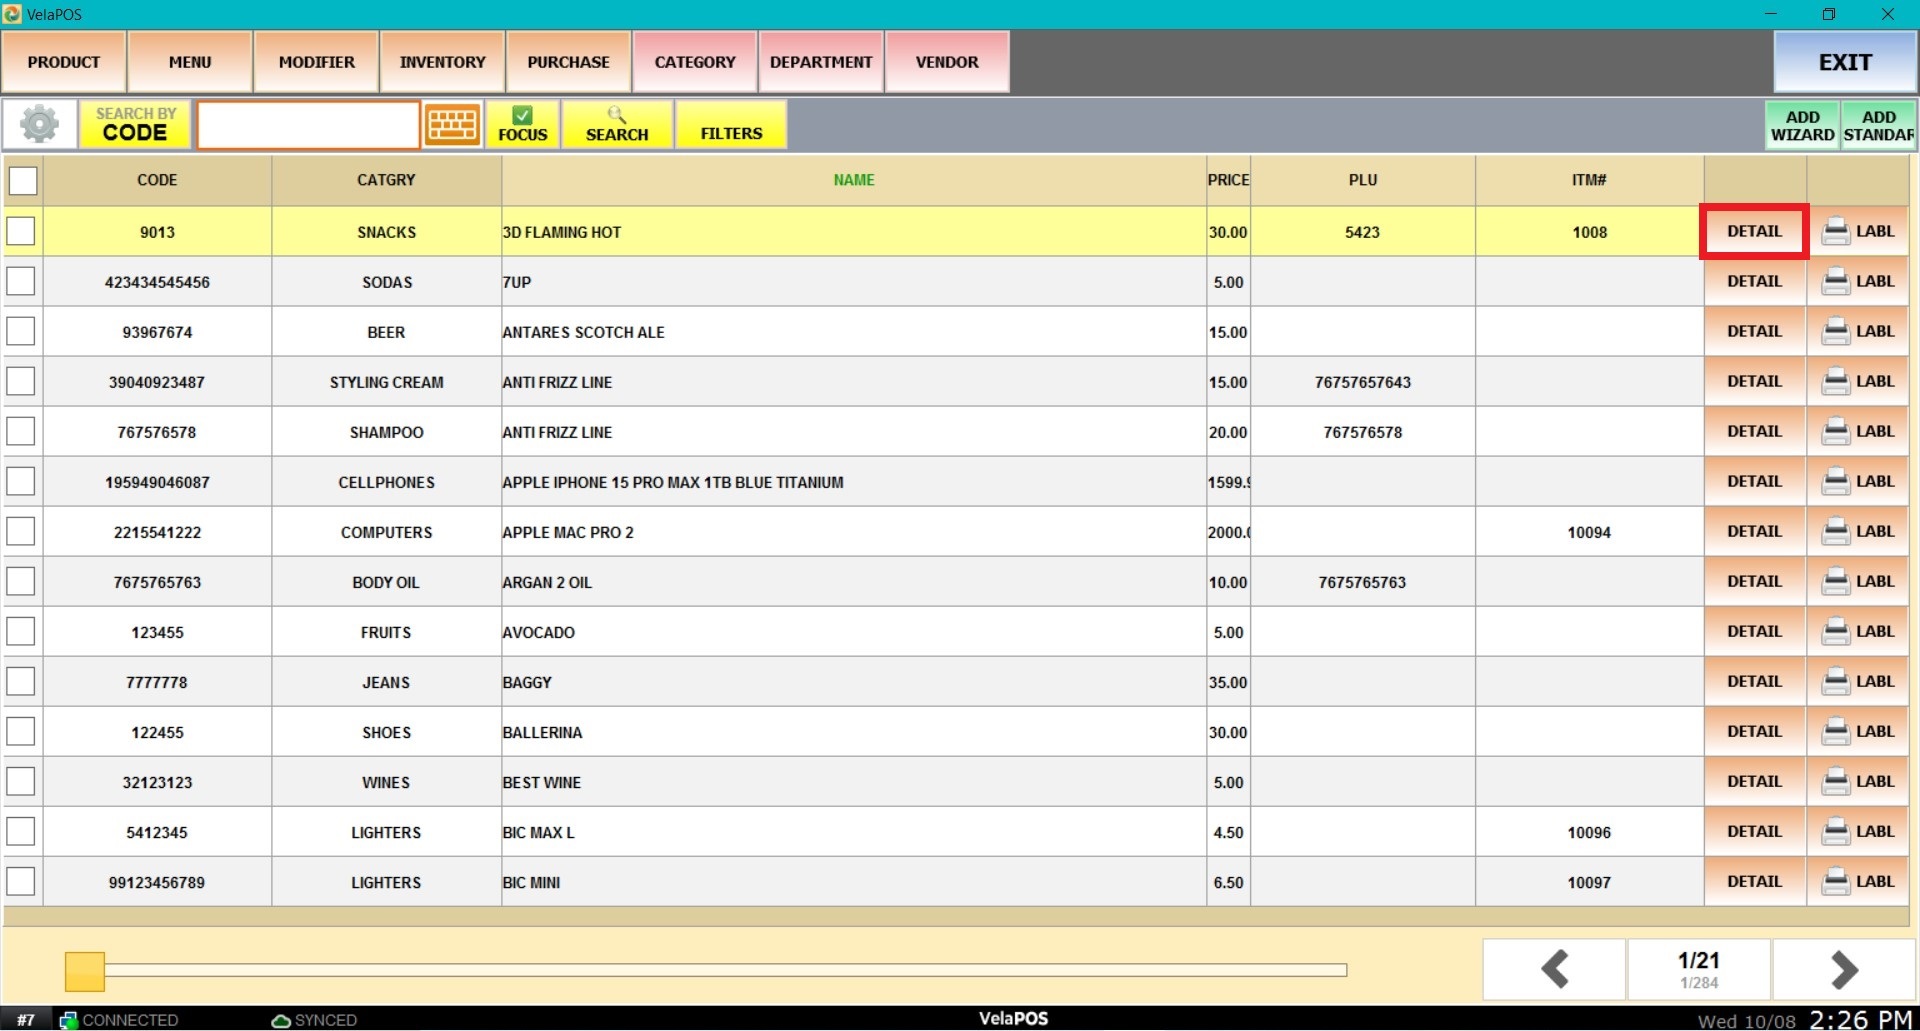
Press on the RPT tab on the product's detail.
SUMMARY
Shows the product's performance over the last 7, 30, and 90 days. It's divided into four sections: Total, Sale, Return, and Addition. Each shows the COUNT (number of transactions of that type) and the QTY (total number of the product included in those transactions).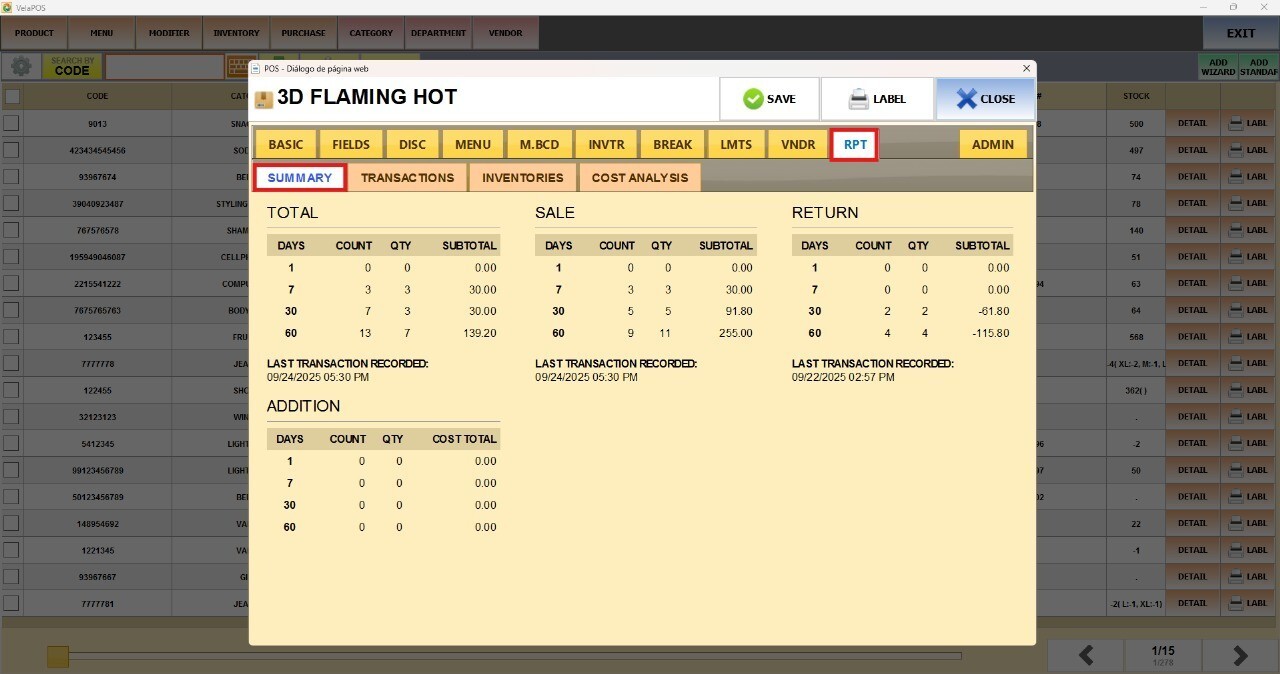
TRANSACTIONS
Displays a list of all transactions that include this item, ordered by date, along with the ticket subtotals, applied discounts, and the employee who processed each sale.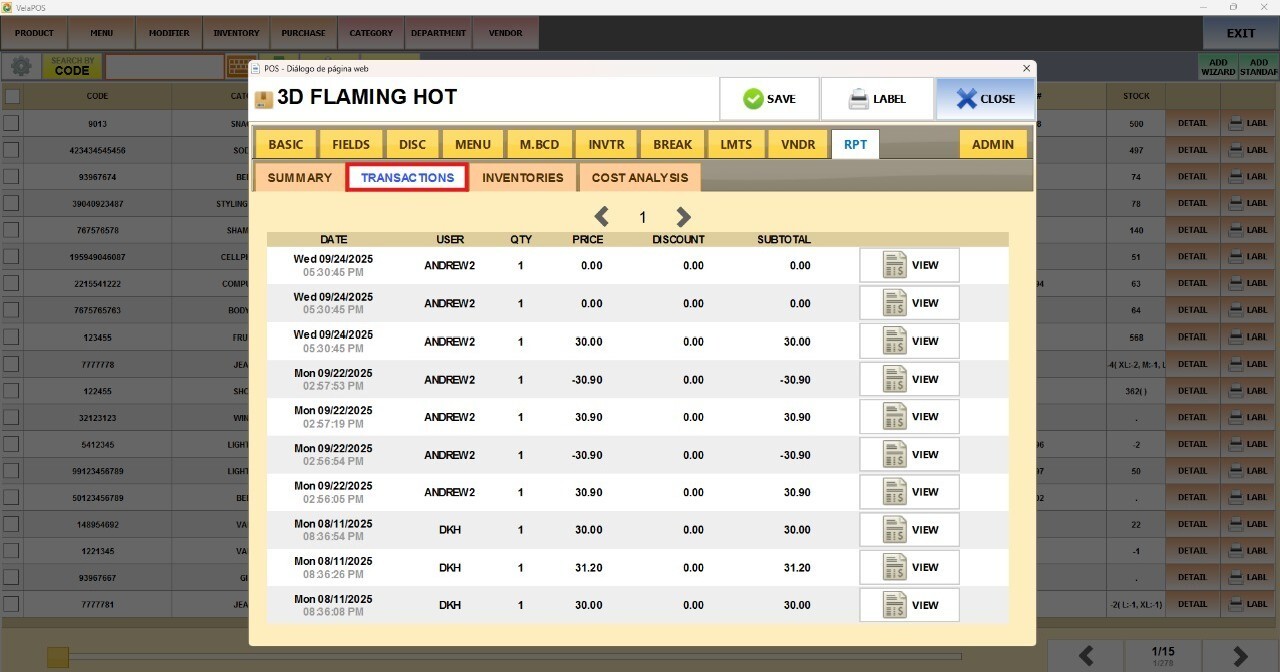
Hint: Each row includes a VIEW button to access more detailed information about that specific transaction. (Store and locations info, customer name, date and time of the transaction, purchased items, subtotal, taxes and fees, total amount paid, the payment method, and change given).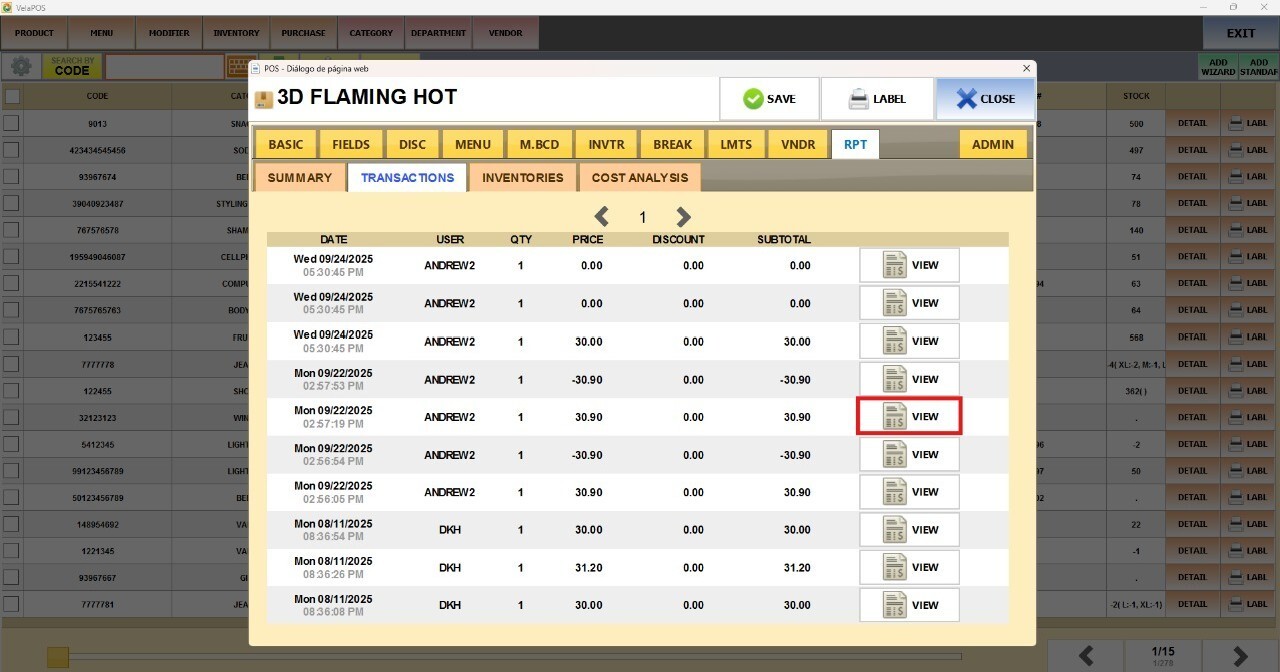

INVENTORIES
Shows how the product's stock has changed over time, including sales, returns, and additions.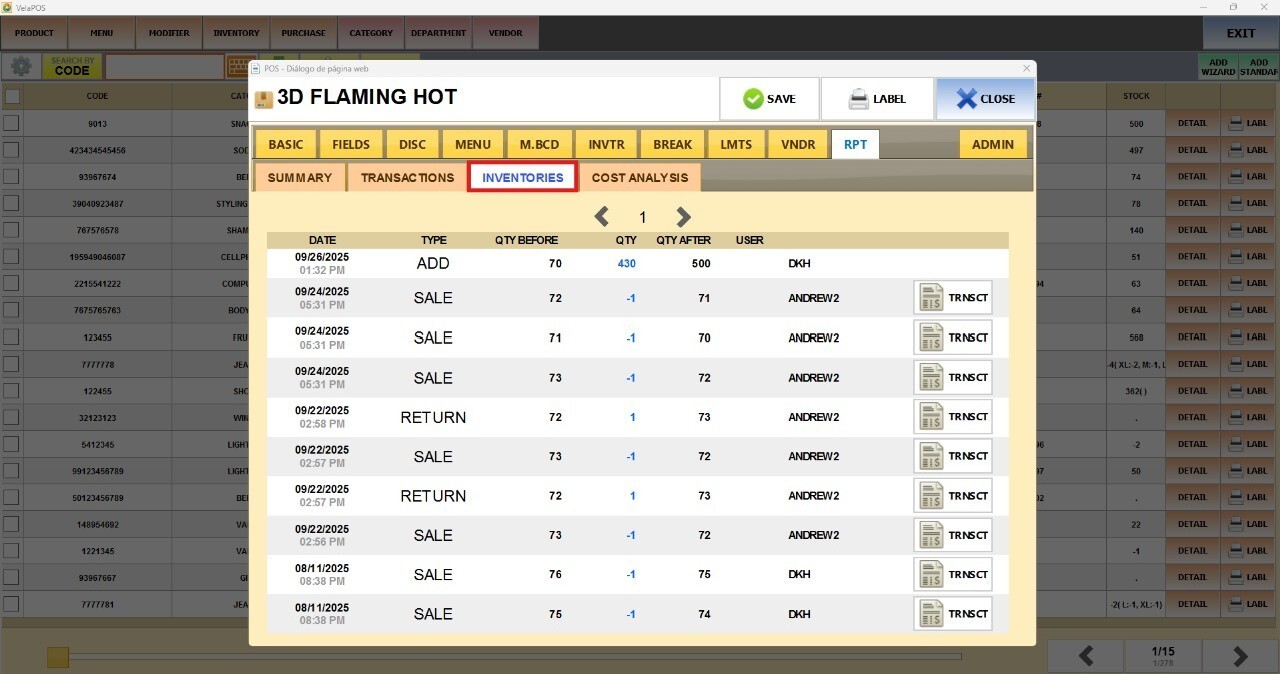
Hint: Each row includes a TRNSCT button that opens a pop-up with full details of the sale, return, or addition. Use it to check what was sold, how it was paid, and confirm totals, all without leaving the product screen.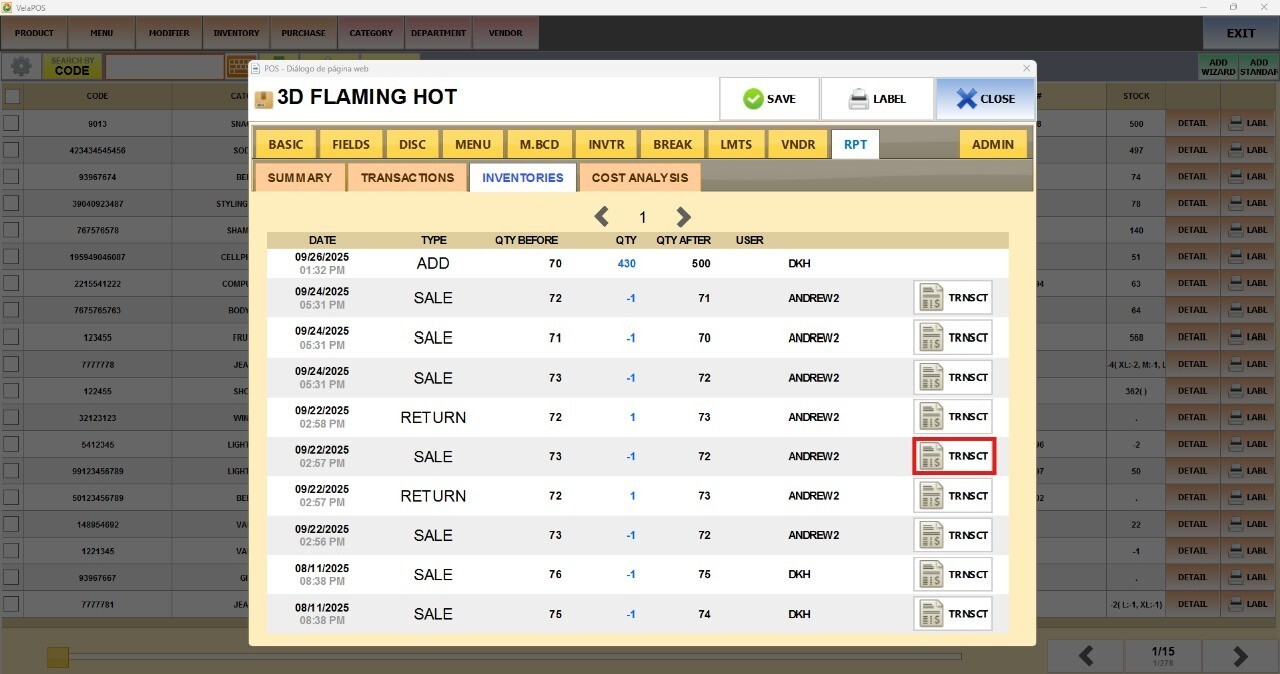

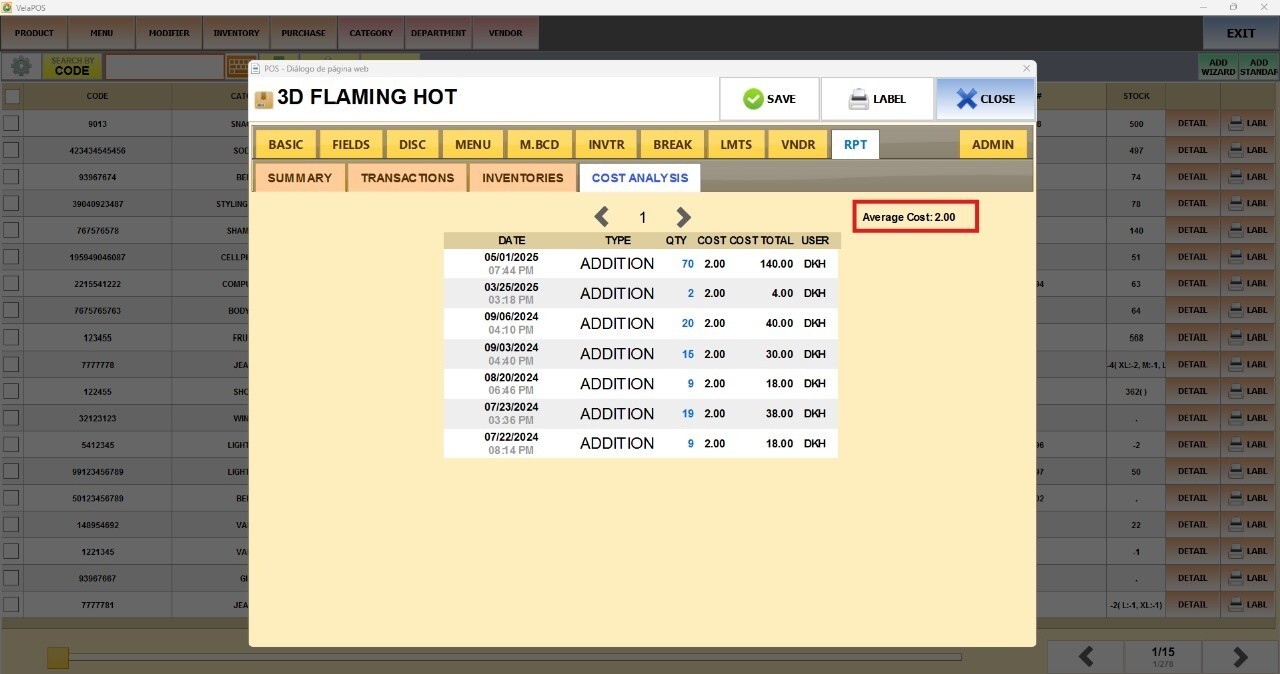
COST ANALYSIS
Displays the unit cost for each inventory addition and the corresponding total quantity added.
Hint: At the top, you'll see the AVERAGE COST of the product.